🧠 Introduction: Drawing Lines is Easy Trading Them Isn’t
Most traders draw trendlines just to feel good. They connect two highs or two lows and hope for magic. But in pro-level trading, trendlines and breakout zones are used with purpose, not guesswork.
When used correctly, trendlines can highlight structure, pressure, and opportunity. And breakout zones? They tell you where money moves fast if you’re ready.
This guide will help you stop winging it and start using trendlines and breakout zones with real precision.
📏 What Are Trendlines (Really)?
Trendlines aren’t just visual guides. They’re tools for mapping pressure and structure. You connect:
- Higher lows in an uptrend
- Lower highs in a downtrend
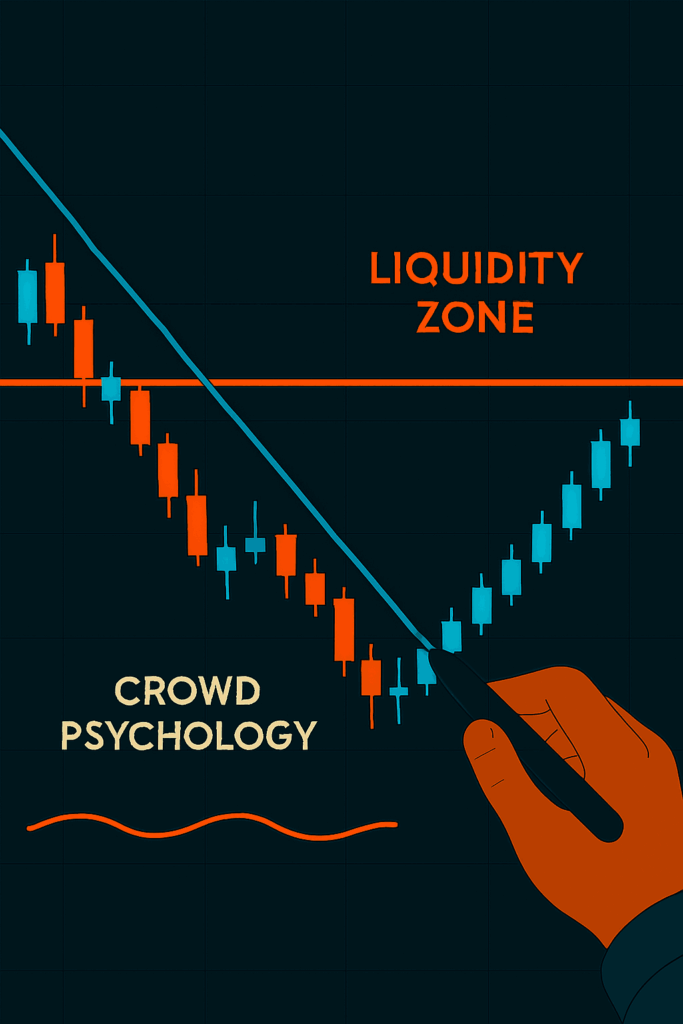
But here’s the pro twist: strong trendlines act like liquidity magnets they attract breakout traders, stop orders, and pullbacks. That’s why they’re powerful not because they’re “magical,” but because they represent crowd psychology.
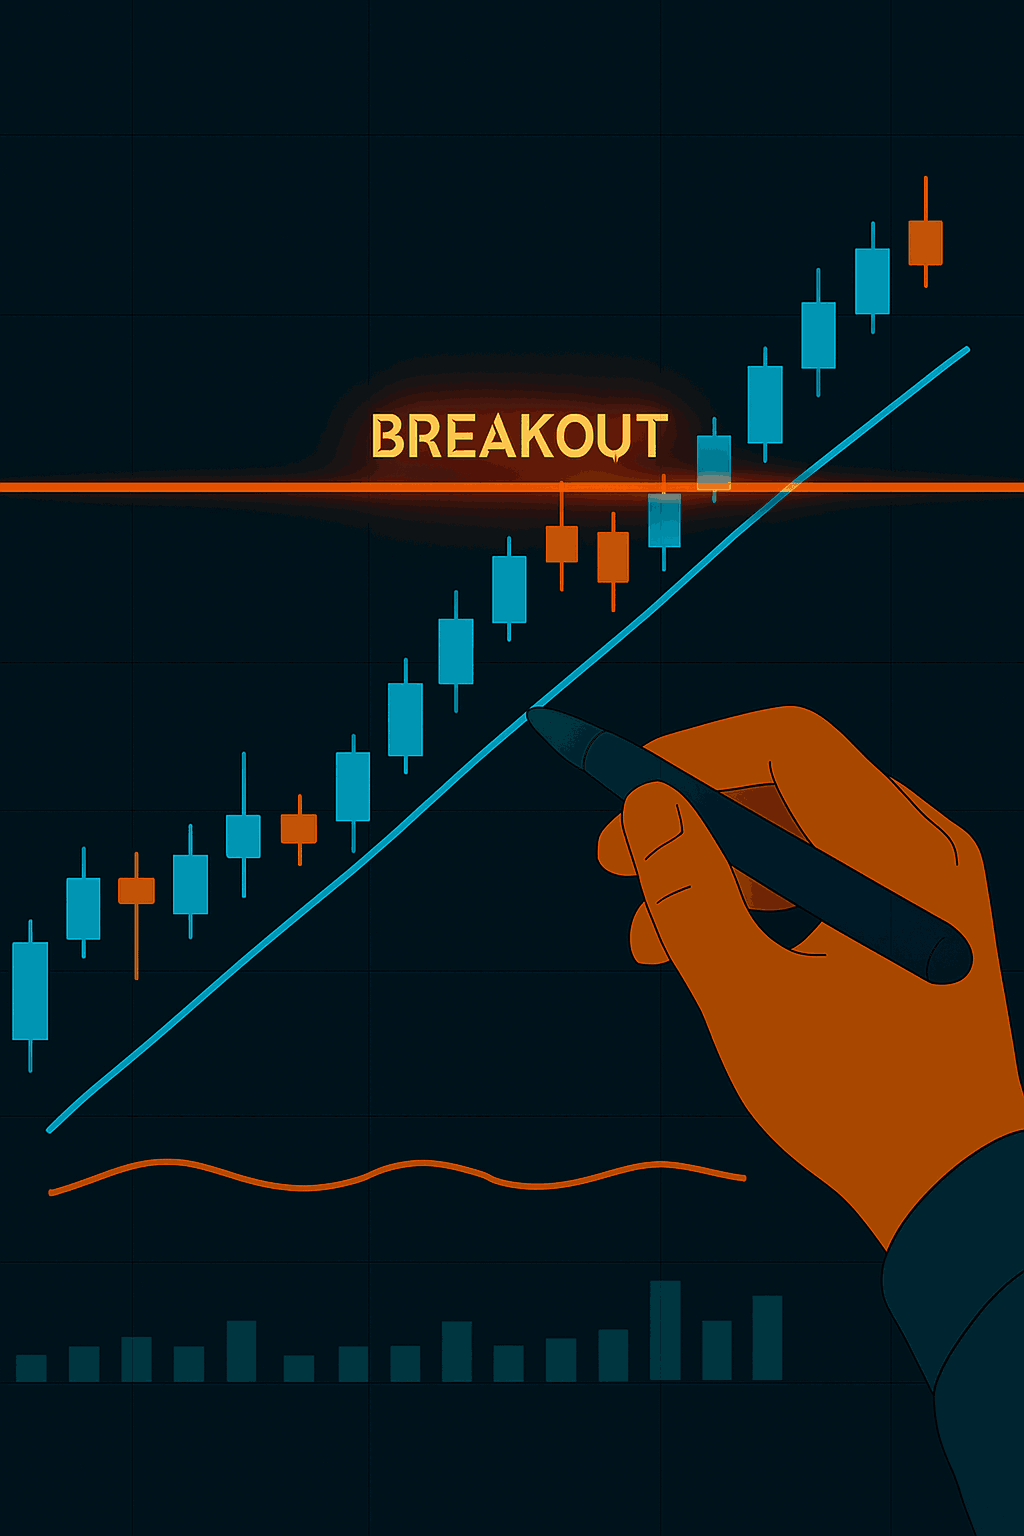
🧱 Breakout Zones: The Real Battleground
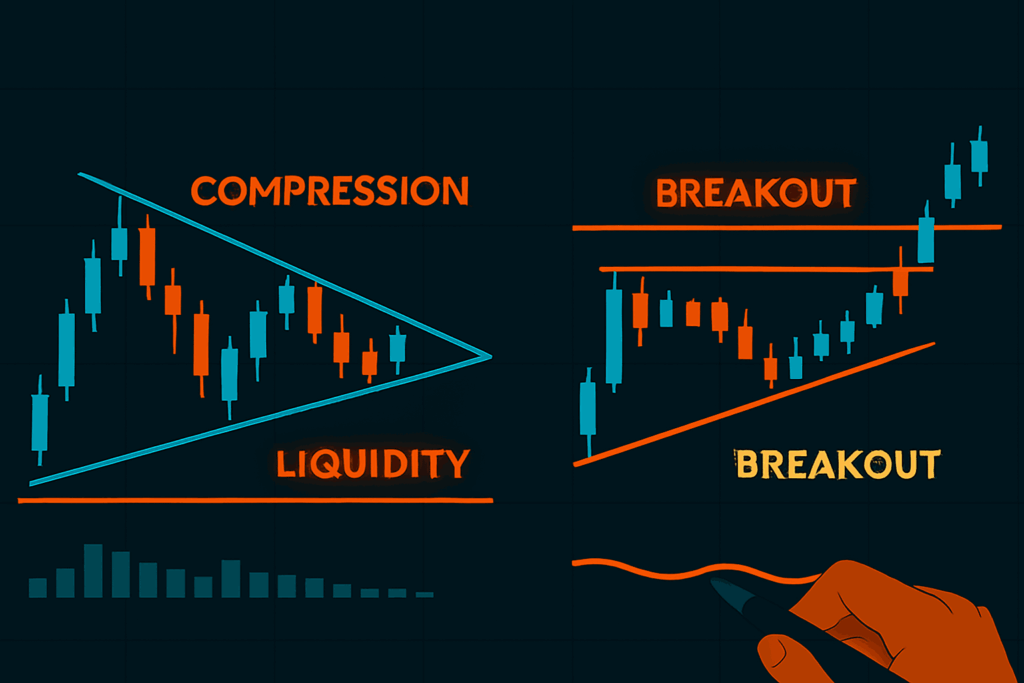
Breakout zones are price areas where accumulation or compression occurs before an explosive move. Think of:
- Wedges
- Triangles
- Flags
- Flat top/flat bottom consolidations
When price breaks these zones with conviction (and volume), volatility surges and that’s where skilled traders strike.
🎯 How to Draw and Use Trendlines Like a Pro
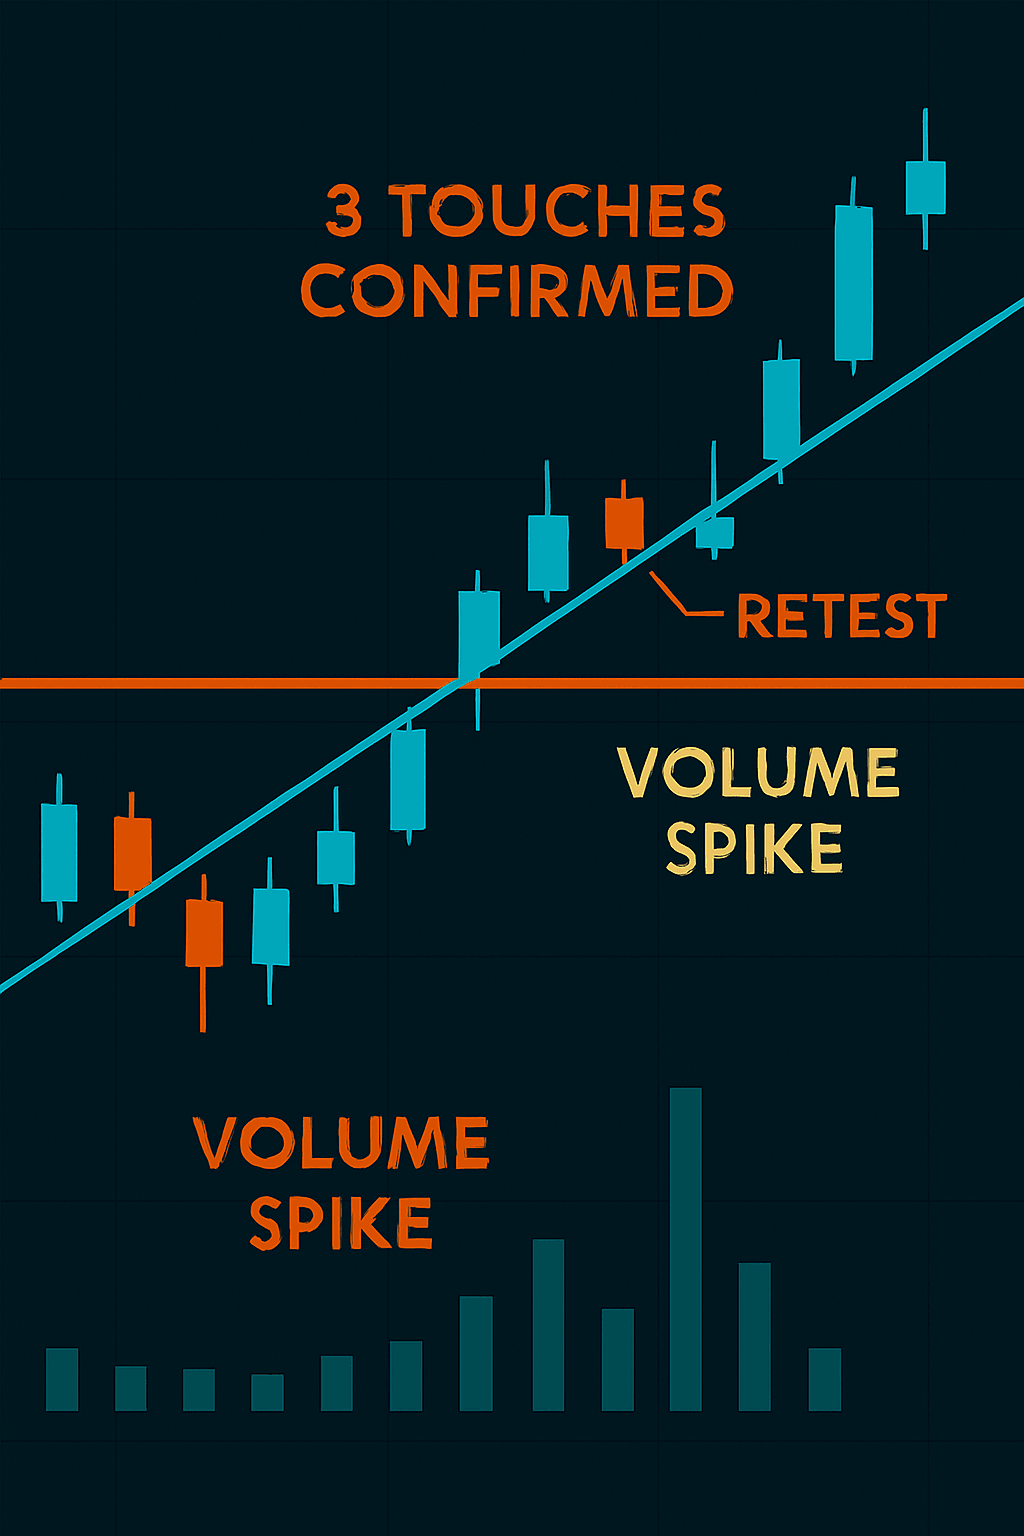
- Only use confirmed swing points.
Don’t force a trendline through noise. Two touches minimum, three is better. - Draw trendlines with wicks, not bodies.
Wicks show real rejection and liquidity grabs perfect for precision entries. - Use trendlines to guide not trade blindly.
A break of a trendline is not an automatic entry. Wait for confirmation:- Retest and bounce (for reversal)
- Break and hold (for continuation)
- Volume spike (for conviction)
🔓 Spotting Breakout Zones
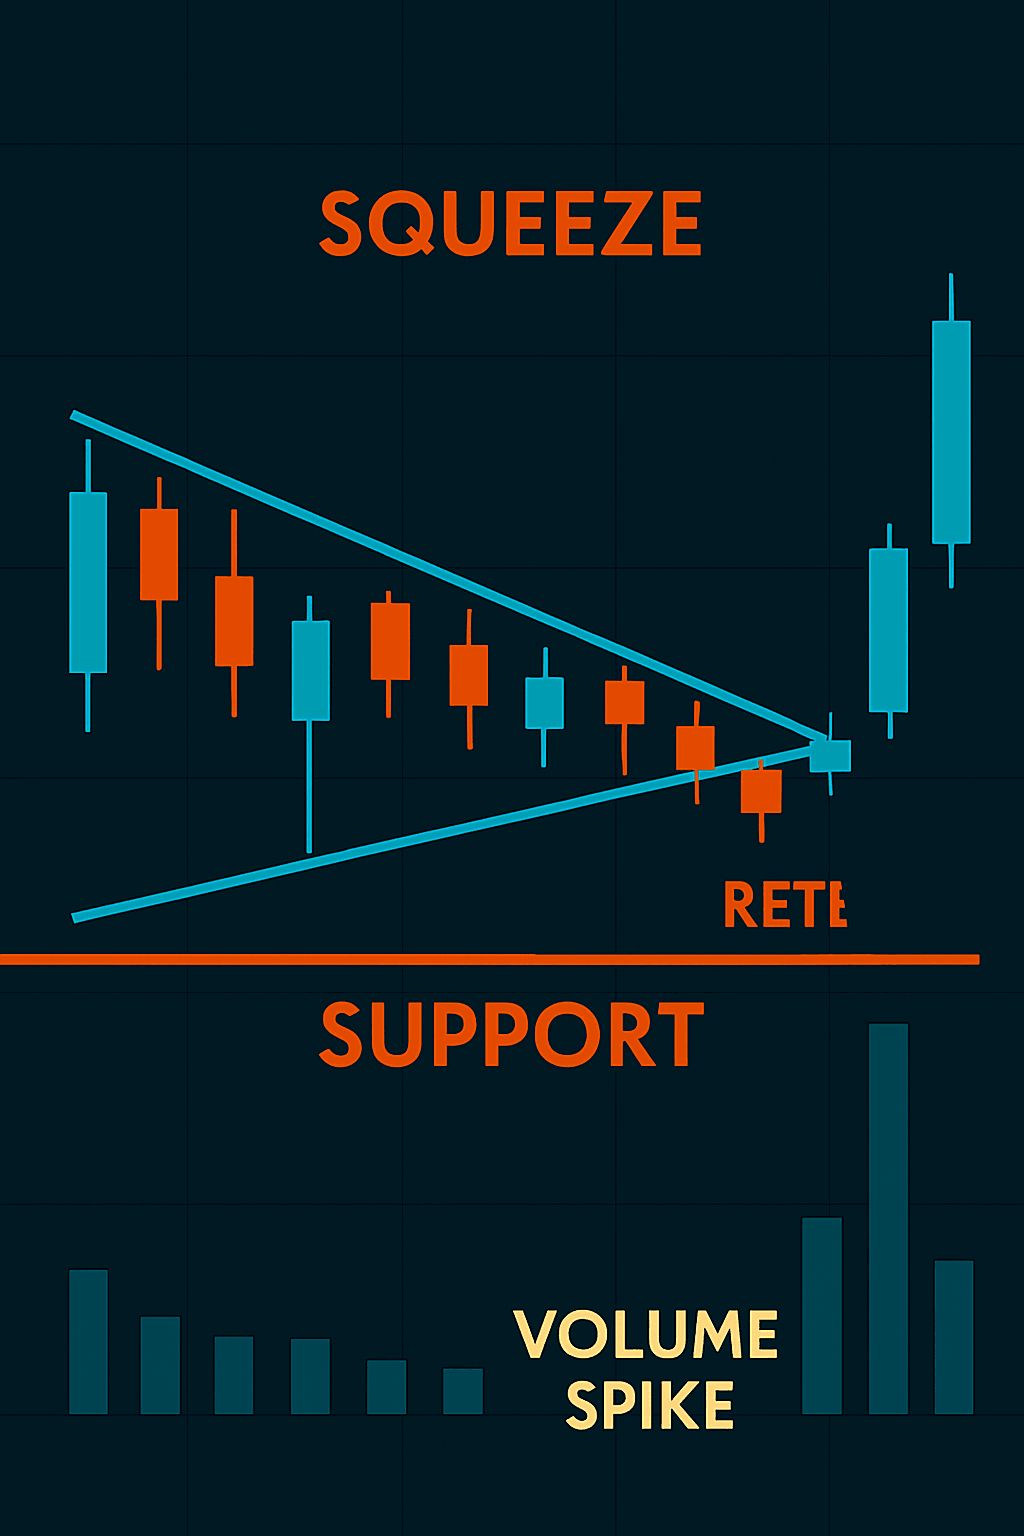
Look for:
- Tight consolidations near key levels
- Lower highs + flat support (or vice versa)
- Squeeze patterns with declining volume
- Multiple rejections from the same area
These zones become liquidity pockets once price breaks through, volatility often follows. This is where you want to strike.
📘 Example Setup: Trendline Break + Breakout Zone on GBP/USD
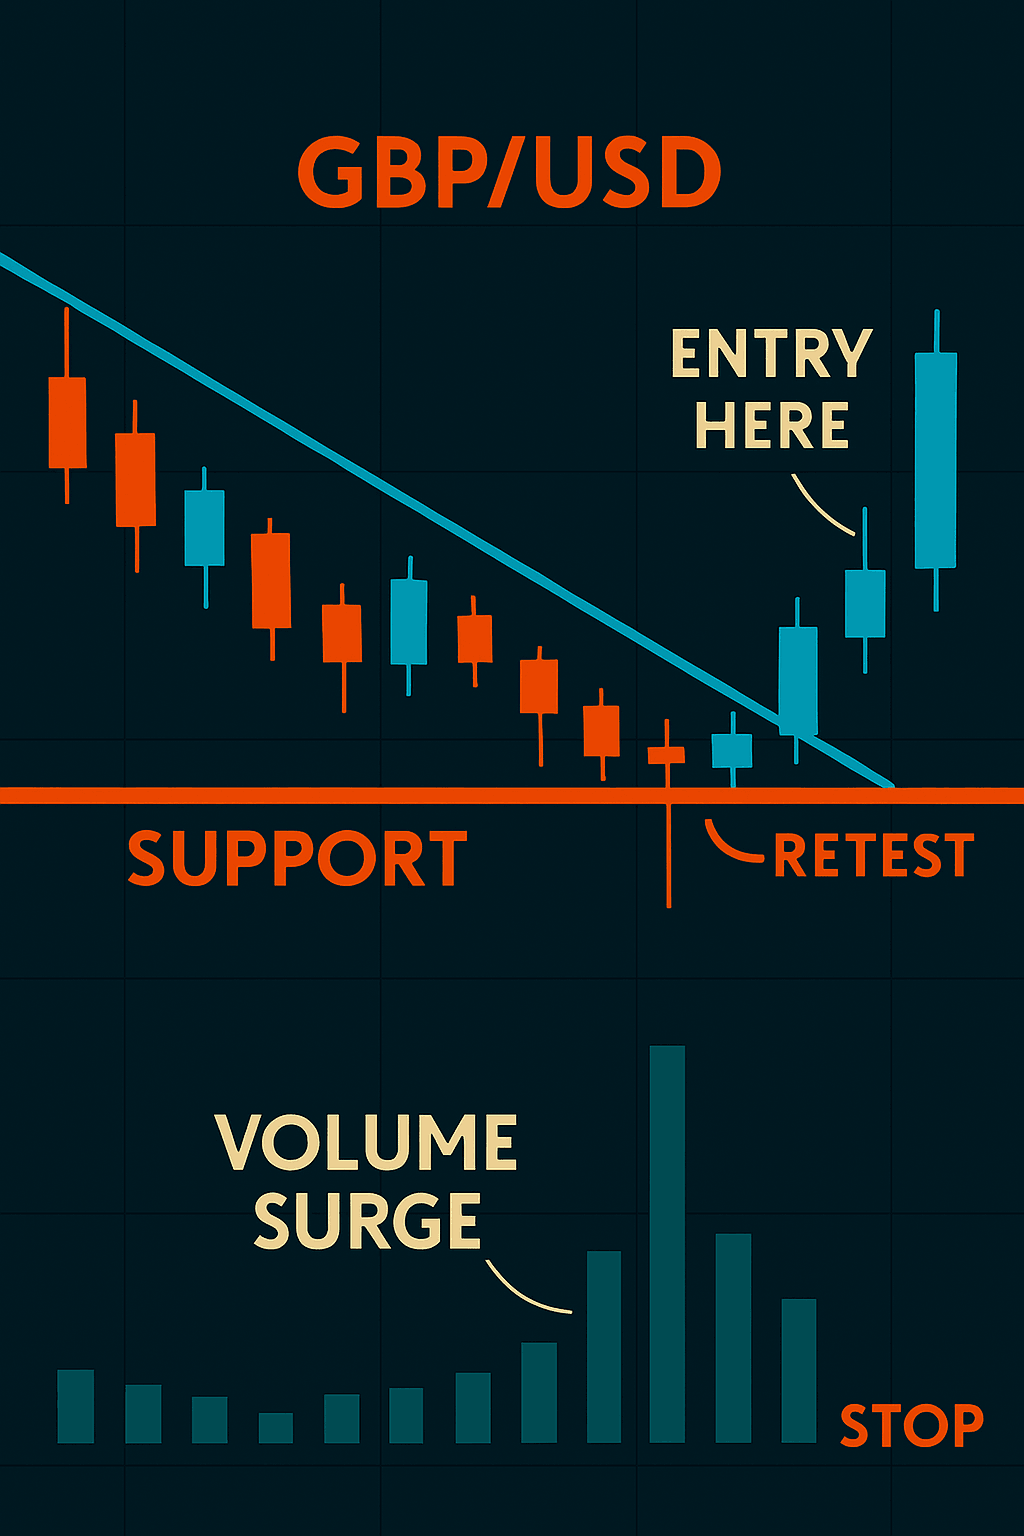
- GBP/USD is in a downtrend with a clean descending trendline.
- Price forms a flat support around 1.2700, creating a descending triangle.
- Volume compresses as price coils under the trendline.
- A breakout candle with strong volume breaks both the trendline and the 1.2700 zone.
- You enter on the break-and-retest of the zone, with stop below the structure.
That’s a clean momentum breakout with confluence from both trendline and zone.
📌 Entry Rules Checklist
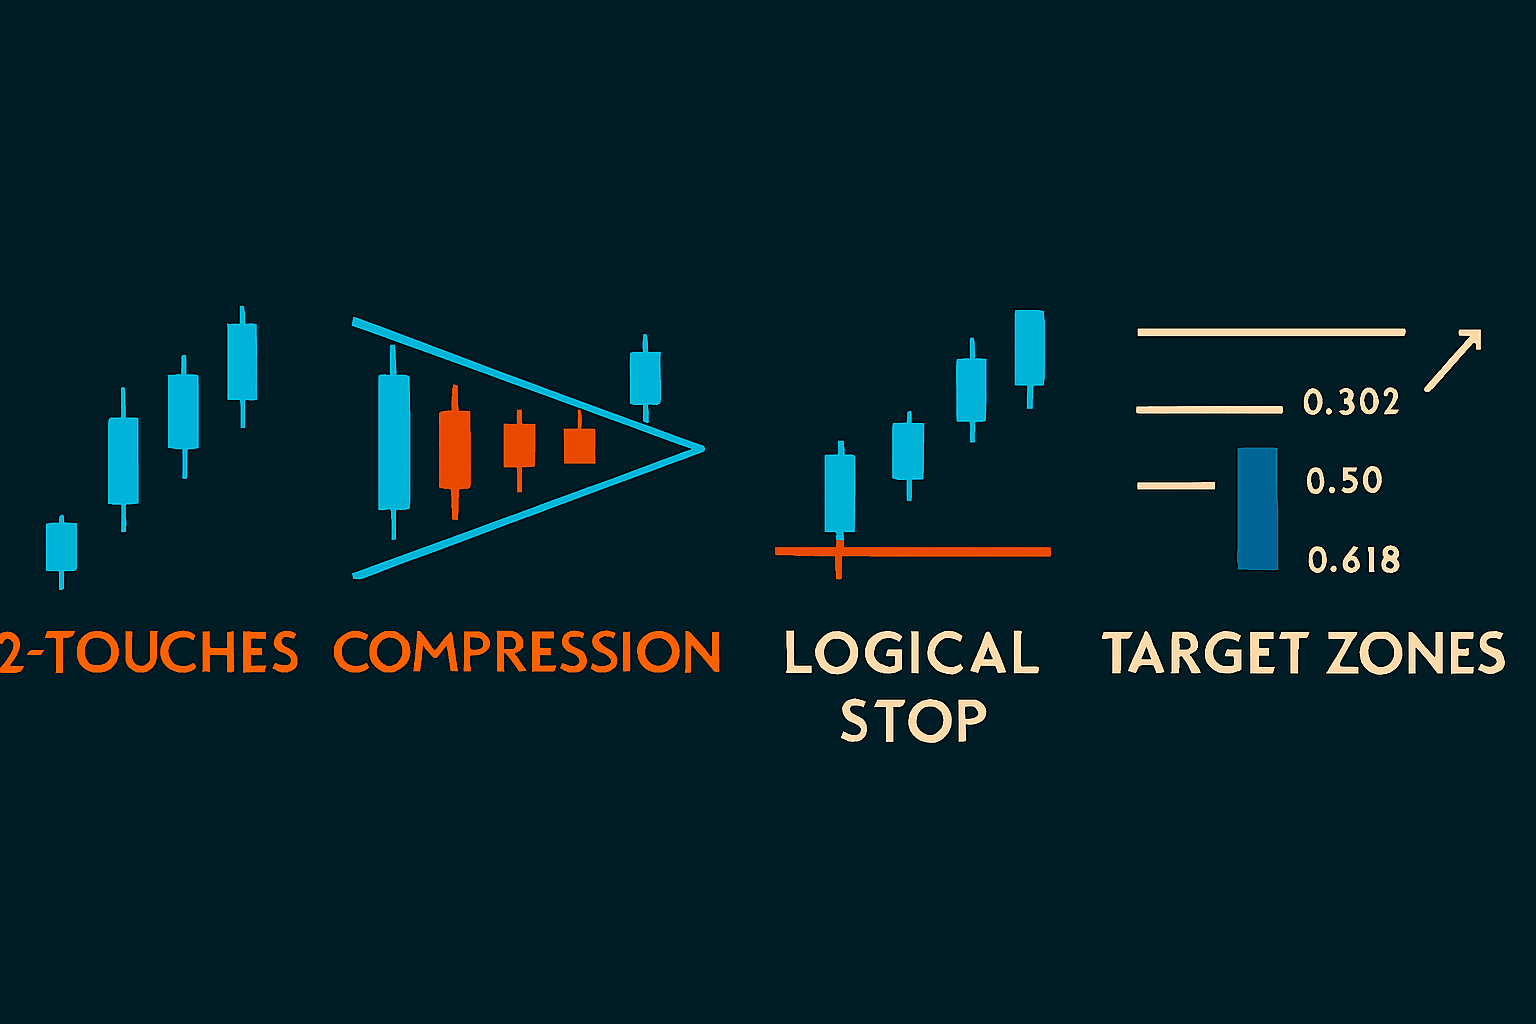
- Confirm trendline with at least two clean touches
- Identify compression before breakout (tight candles, volume drop)
- Wait for break and hold, not just wick breaks
- Use structure (like previous highs/lows) to place stop-loss logically
- Target previous imbalance zones, untested highs/lows, or Fib extensions
⚠️ Mistakes to Avoid
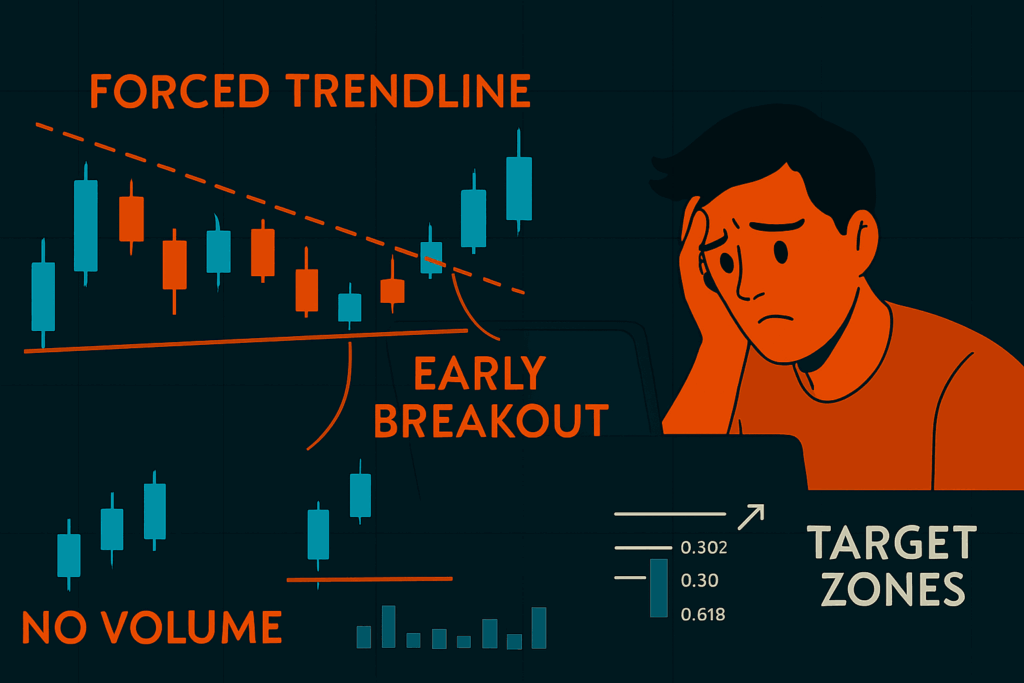
- Forcing trendlines where they don’t belong
- Jumping in on the first breakout candle without confirmation
- Ignoring volume no volume, no conviction
- Holding trades through failed breakouts hoping for miracles
- Using trendlines alone without structure or price action context
🧭 Final Thoughts

Precision with trendlines and breakout zones isn’t about being perfect it’s about being intentional. These tools help you define pressure, trap zones, and breakout points. When used with volume, market structure, and patience, they give you an edge most retail traders miss.
So next time you draw a trendline or mark a zone ask yourself: “Is this where the market will make a decision?”
If yes, that’s where your opportunity lives.