🧠 Introduction: Stop Chasing Price Start Following Volume
Price action tells you where the market is, but volume tells you why it’s there.
Most retail traders focus on indicators and patterns. But institutions? They watch volume profile strategies the horizontal visualization of traded volume at price levels. It reveals the areas where the market truly cares, helping pros enter and exit with precision.
In this guide, you’ll learn how to use volume profile to find high-probability institutional zones, avoid fakeouts, and time entries like the big players.
🔍 What is Volume Profile?
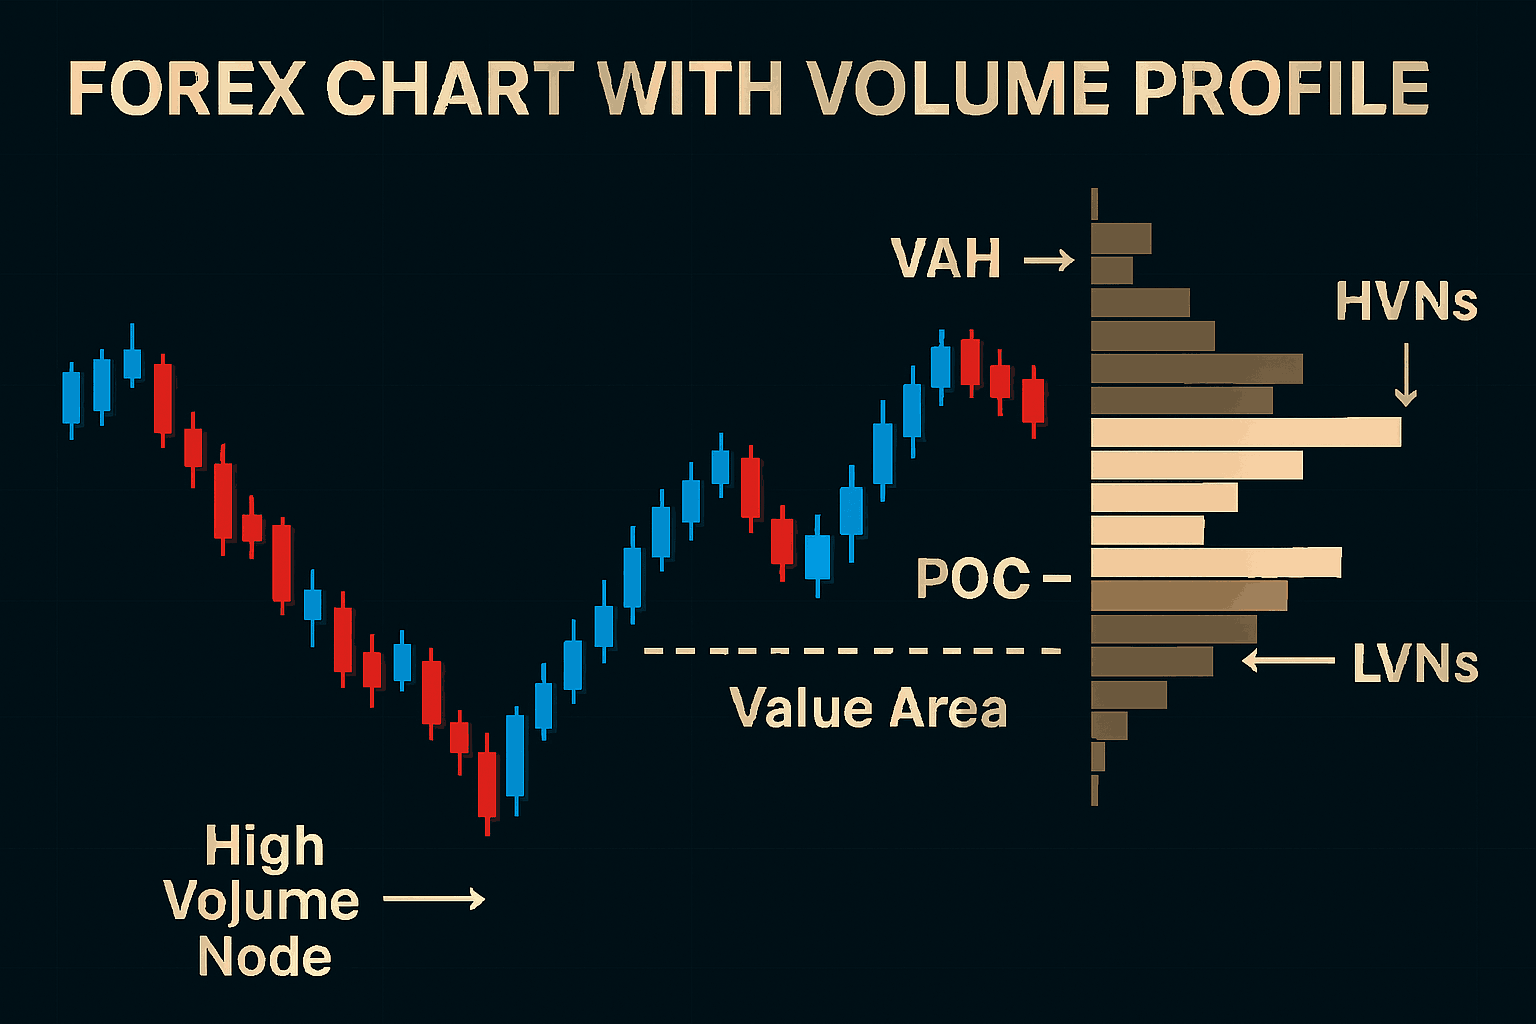
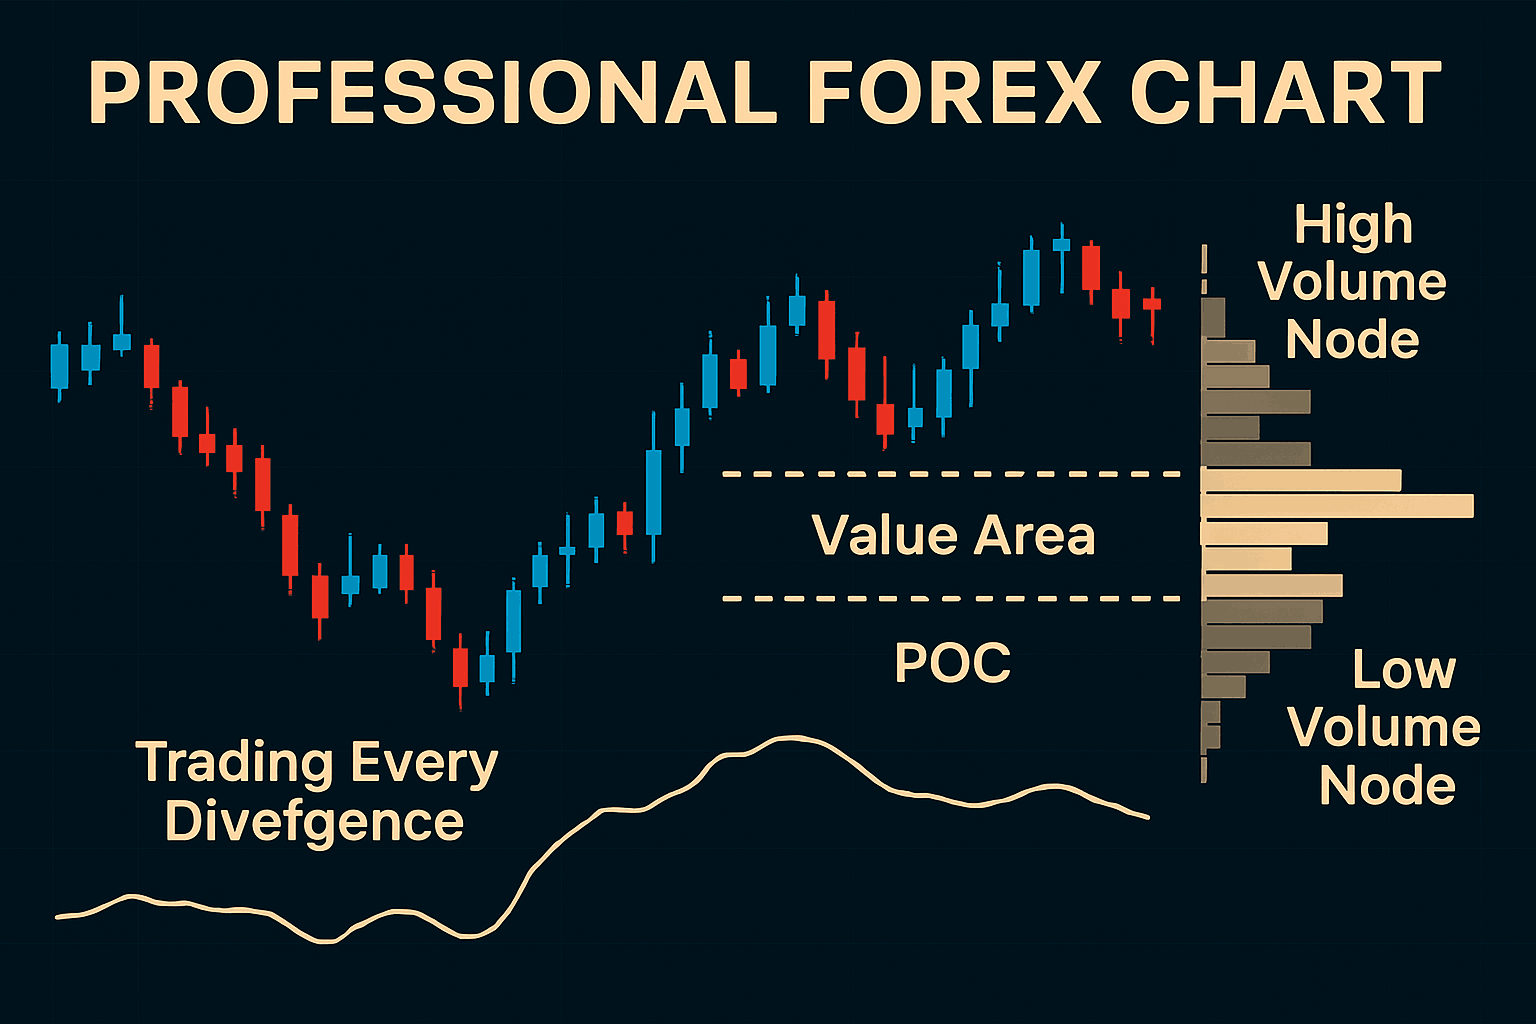
Volume profile plots a histogram on the vertical axis of your chart, showing how much trading occurred at each price level, not just over time.
Key elements include:
- POC (Point of Control): The price level with the highest traded volume.
- Value Area (VA): The price range where 70% of volume occurred.
- High/Low Volume Nodes (HVN/LVN): Areas of price acceptance vs. rejection.
While candles show you time-based volume, volume profile shows price-based interest a major edge in forex trading.
🎯 Why Volume Profile Strategies Beats Traditional Volume Indicators
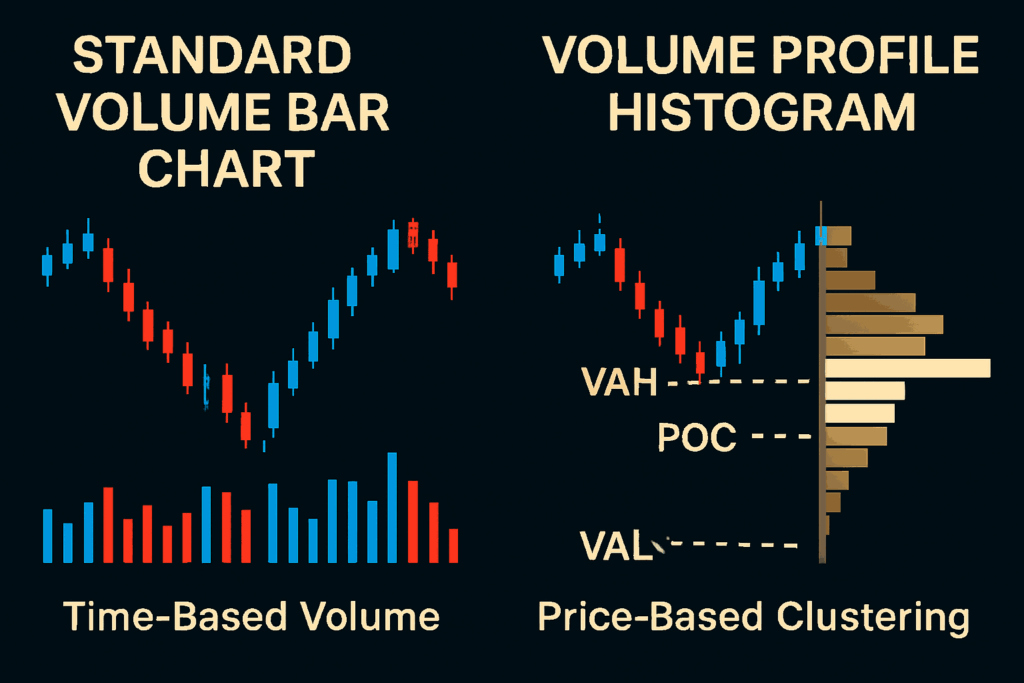
Standard volume bars tell you when volume surged, but they don’t show where in price that volume clustered.
Volume profile helps identify:
- Where smart money is accumulating/distributing
- True support/resistance zones that aren’t just psychological they’re backed by actual market participation
- Liquidity traps and fake breakouts
- Optimal entry points during consolidations or break-and-retest plays
🧱 Core Strategy: Trading Around Value Areas
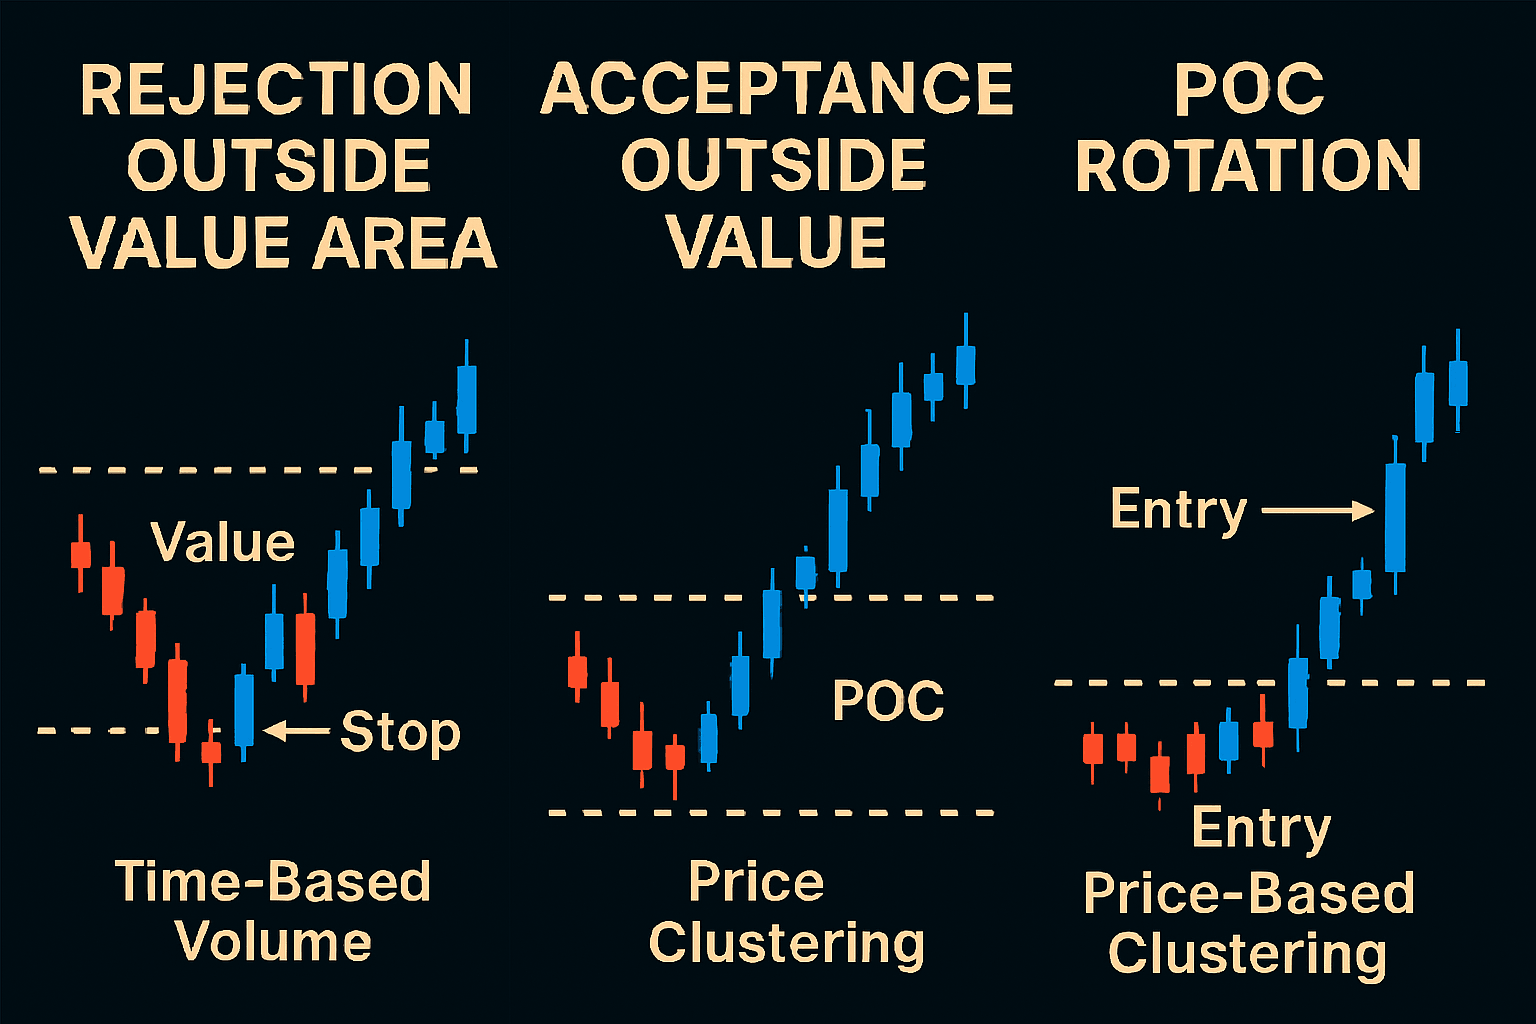
- Rejection Outside Value → Mean Reversion Trade
If price breaks above the Value Area High (VAH) but quickly gets rejected back in, it’s a signal that buyers are exhausted. This creates a setup to trade back toward the POC or Value Area Low (VAL). - Acceptance Outside Value → Trend Continuation
If price breaks out and holds above the VAH with increasing volume, it indicates new value being established great for breakout or trend continuation setups. - POC Rotation → Institutional-Level Entries
When price rotates around the Point of Control without breaking structure, it shows accumulation or distribution. Enter with small size, scale in as direction confirms, and place stops just beyond the value zone.
📘 Example Setup: USD/JPY Break and Retest with Volume Profile
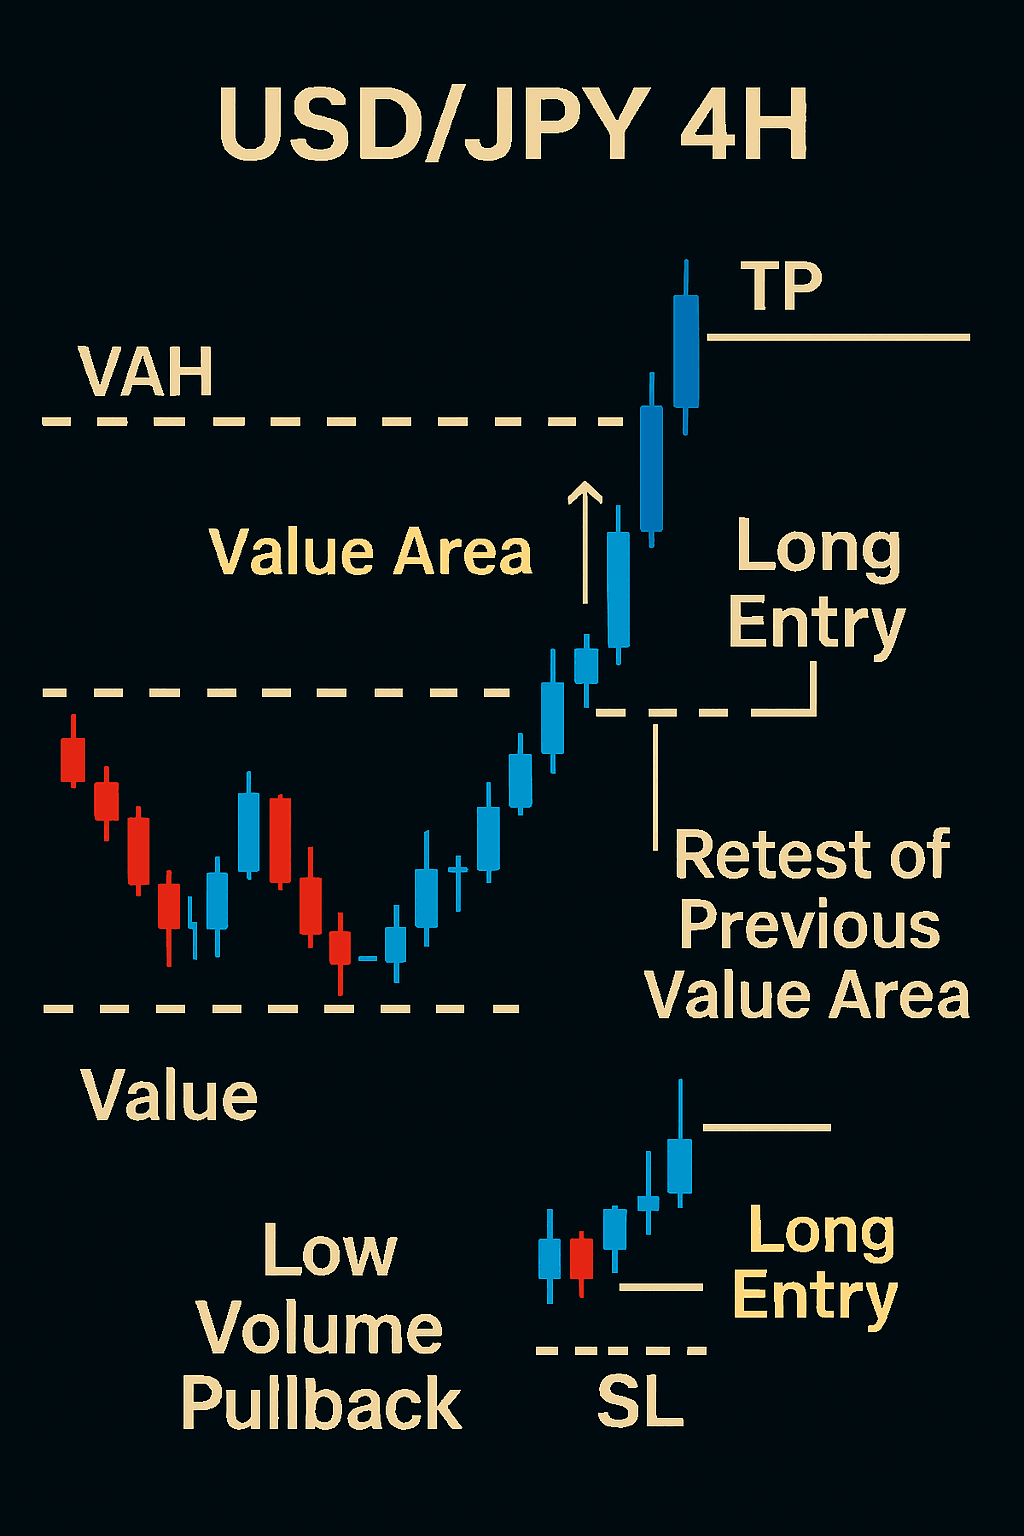
- On the 4H chart, price breaks above the VAH with strong momentum.
- Volume profile shows a new POC forming above the old one institutions are bidding higher.
- Price pulls back, retests the previous VAH, and holds with low volume on the pullback (bullish sign).
- You enter long with stop below the old VAH and target the next HVN or extension zone.
This is how institutions build positions quietly, at key volume levels, not during emotional spikes.
🔧 Tools to Use
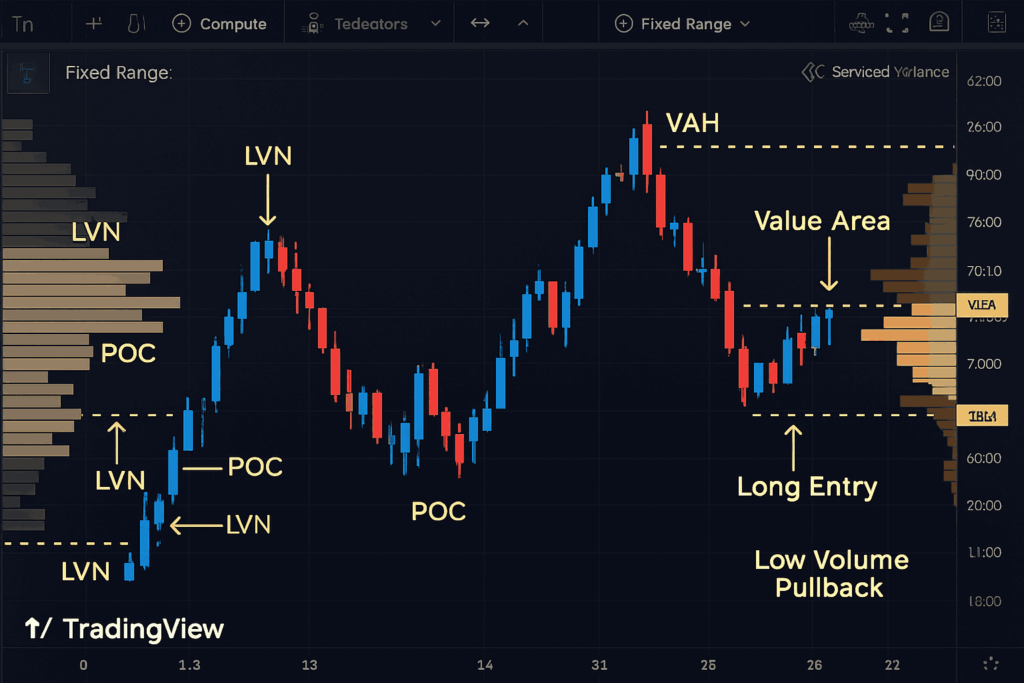
- TradingView or Sierra Chart: Best platforms for volume profile
- Session Volume Profile: Focuses on individual trading sessions (great for intraday)
- Fixed Range Profile: Allows you to analyze specific price moves or swing ranges
- Volume Delta / Footprint (Optional): For those who want extra depth into buy/sell pressure at specific levels
⚠️ Mistakes to Avoid
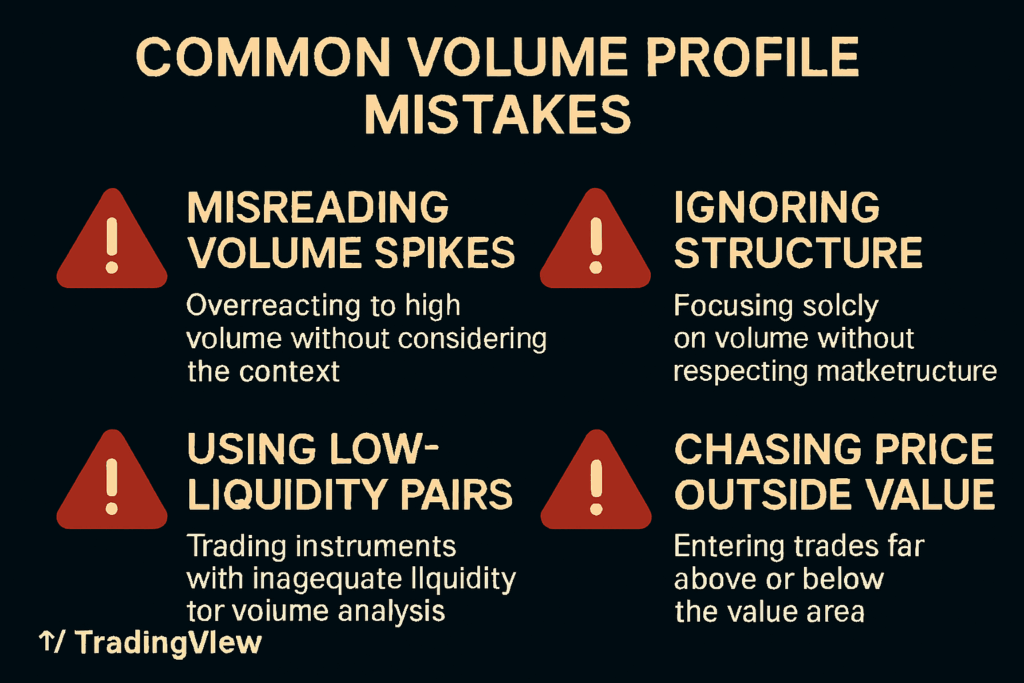
- Misinterpreting volume spikes as directional clues volume is context-sensitive.
- Ignoring market structure volume profile should confirm your technical zones, not replace them.
- Using volume profile on low-liquidity pairs stick to majors and high-volume sessions.
- Chasing price outside of value areas without confirmation it’s often a trap.
🧭 Final Thoughts
Volume profile gives you X-ray vision into institutional behavior. It tells you where money is really being made or lost. When combined with strong market structure and discipline, it allows you to enter like a sniper, not a gambler.
Master this, and you’ll stop reacting to price and start anticipating the moves behind it.