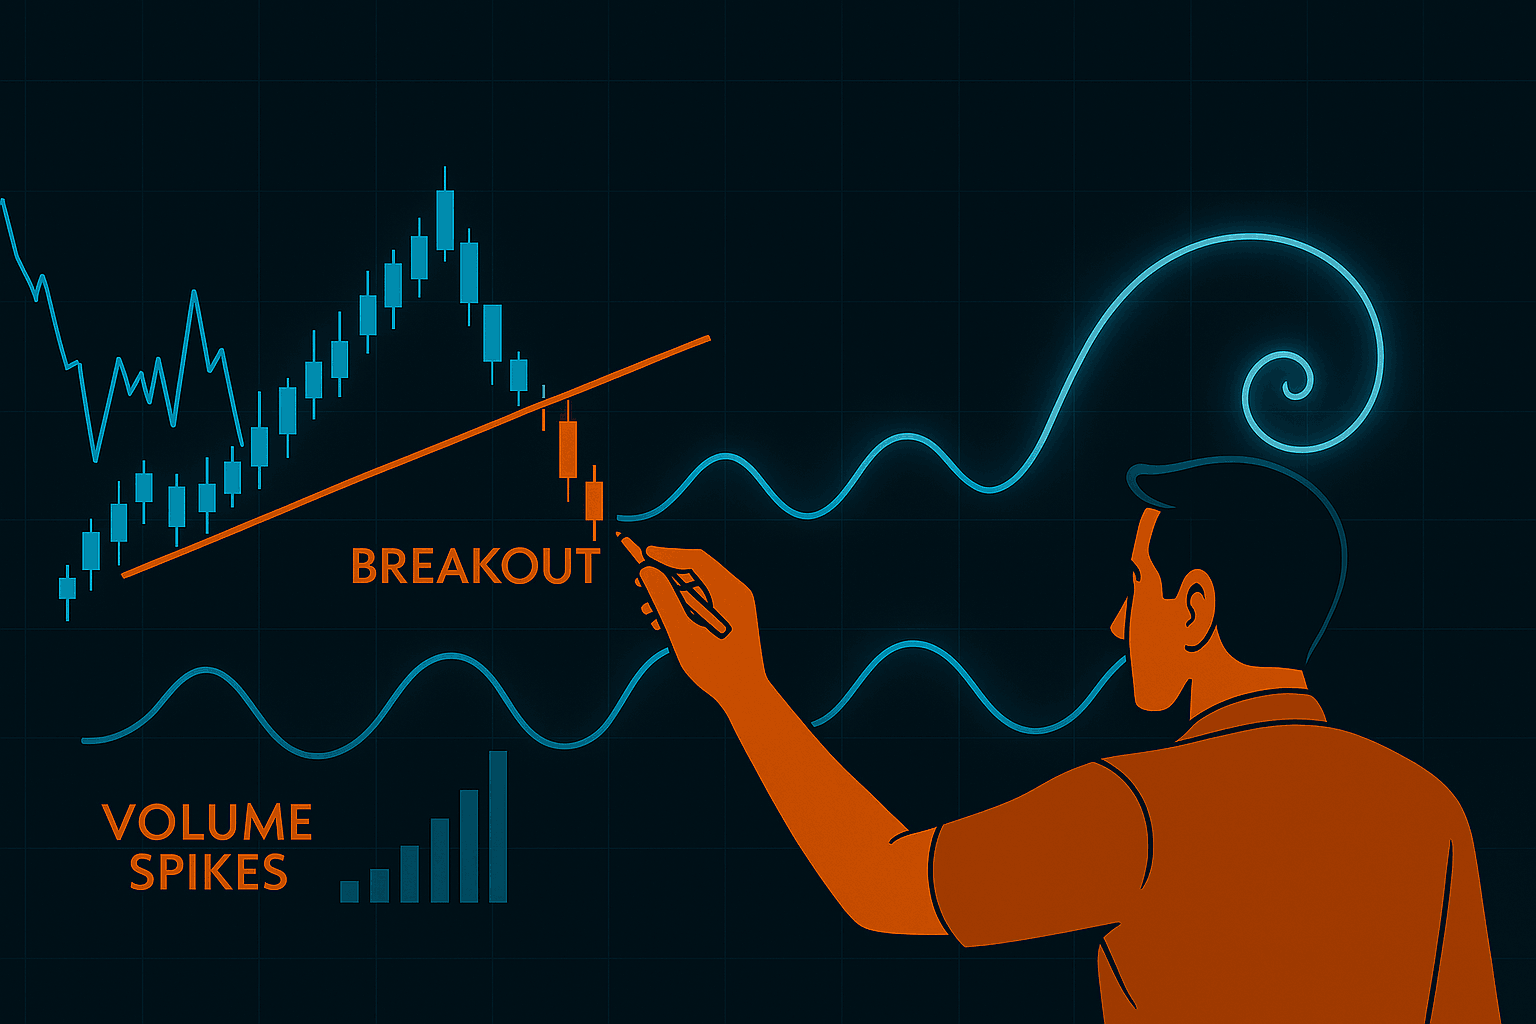
🧠 Introduction: Chaos Has a Pattern If You Know Where to Look
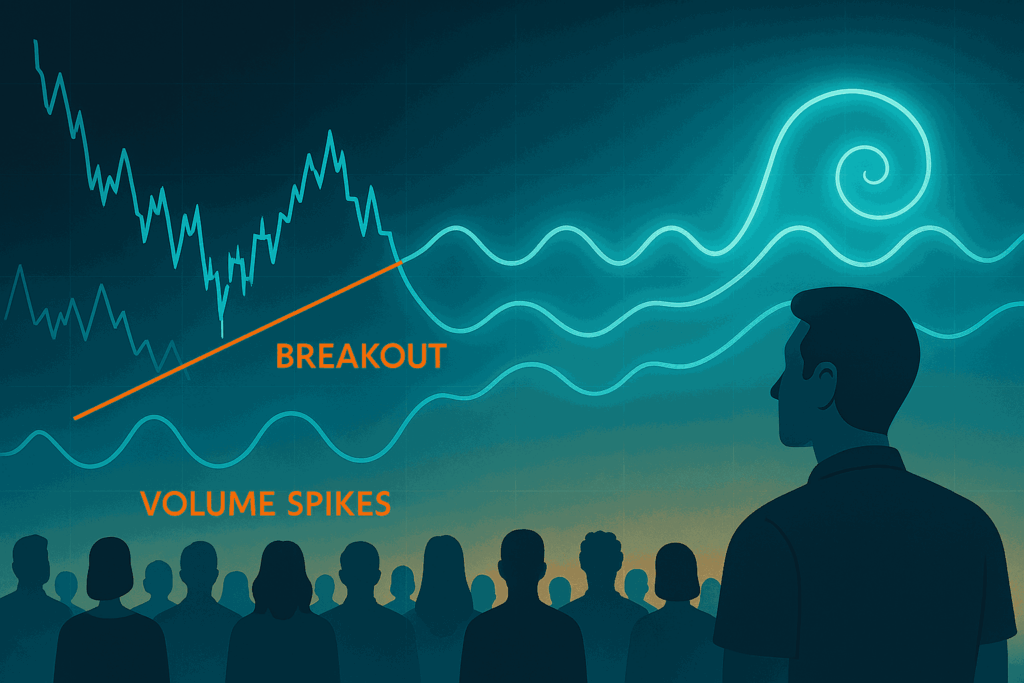
The markets may look chaotic, but deep beneath the surface, waves of crowd psychology unfold in repeating cycles. That’s the foundation of Elliott Wave Theory a framework that maps human behavior through patterns in price movement.
While many traders avoid it due to its complexity, those who learn to read waves properly can predict market moves with remarkable accuracy before the news even hits.
In this guide, we’re going to simplify Elliott Wave analysis and show you how to apply it in real trading, not just theory.
🌊 What is Elliott Wave Theory?
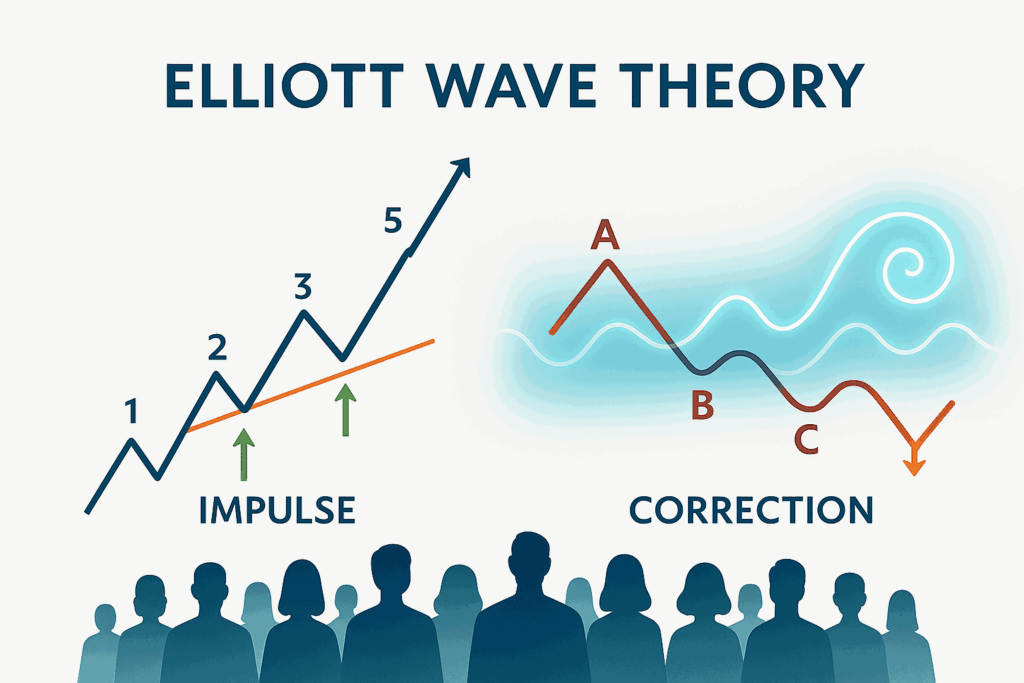
Developed by Ralph Nelson Elliott in the 1930s, the theory proposes that market prices move in predictable wave patterns based on crowd emotion.
It’s built around two types of waves:
- Impulse Waves (move in the direction of the trend)
- Corrective Waves (move against the trend)
A full cycle looks like this:
- 5 waves up (or down) in the direction of the main trend
- Followed by 3 waves of correction (called an ABC correction)
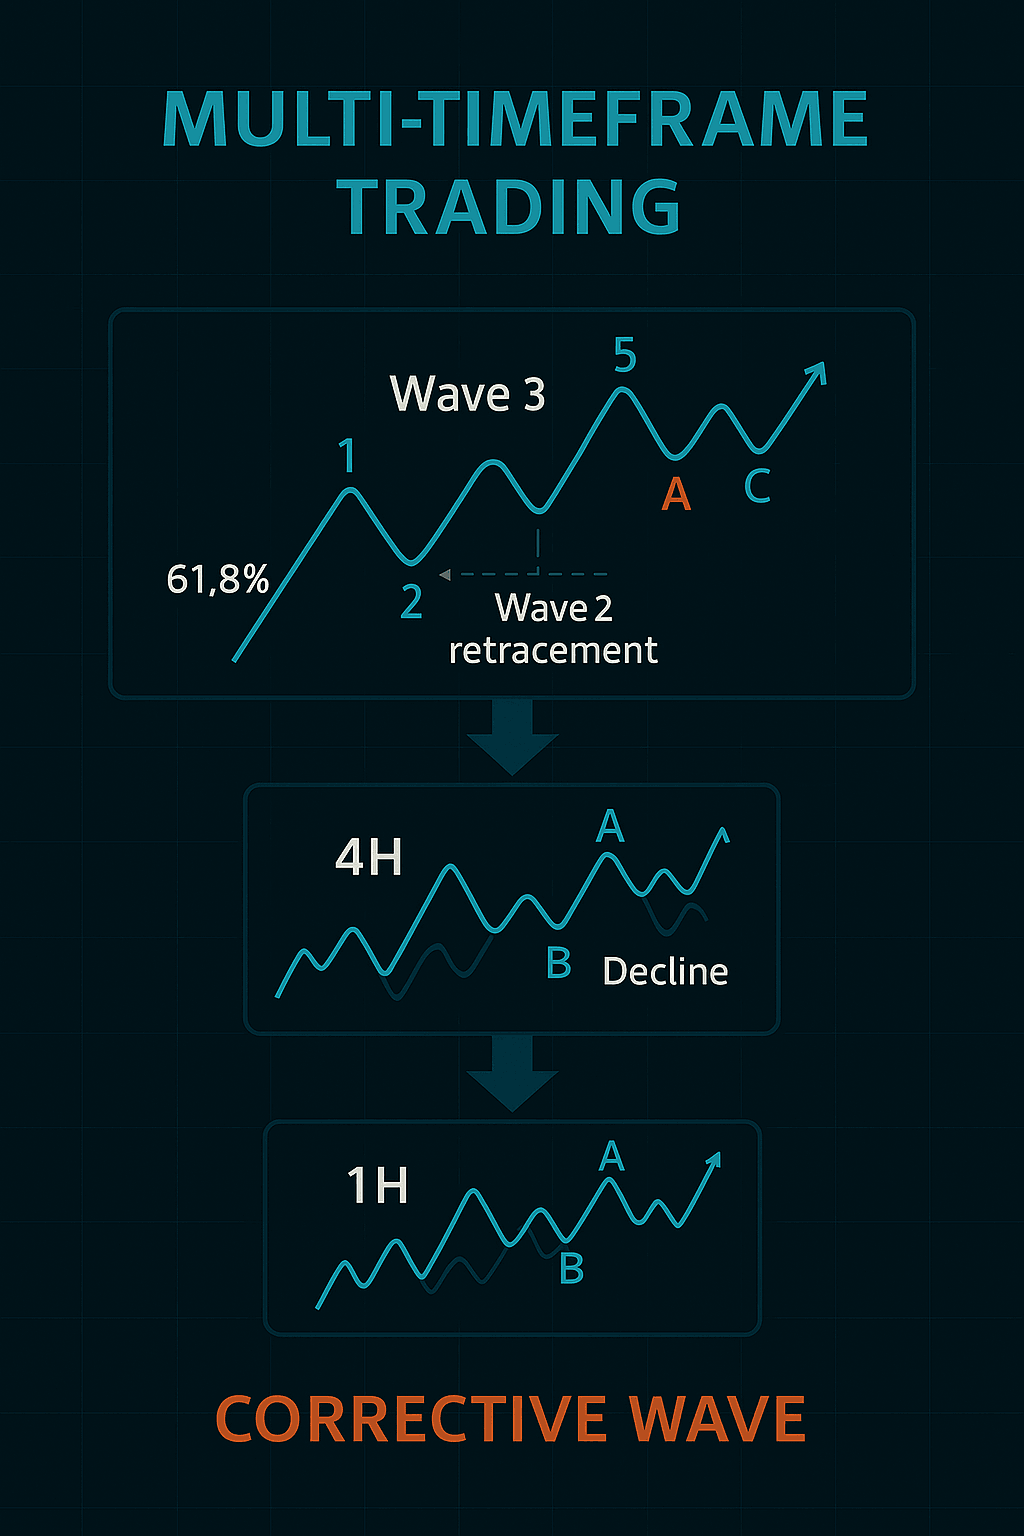
This 5–3 structure repeats on every timeframe from minutes to monthly charts.
🔢 Basic Wave Structure Breakdown
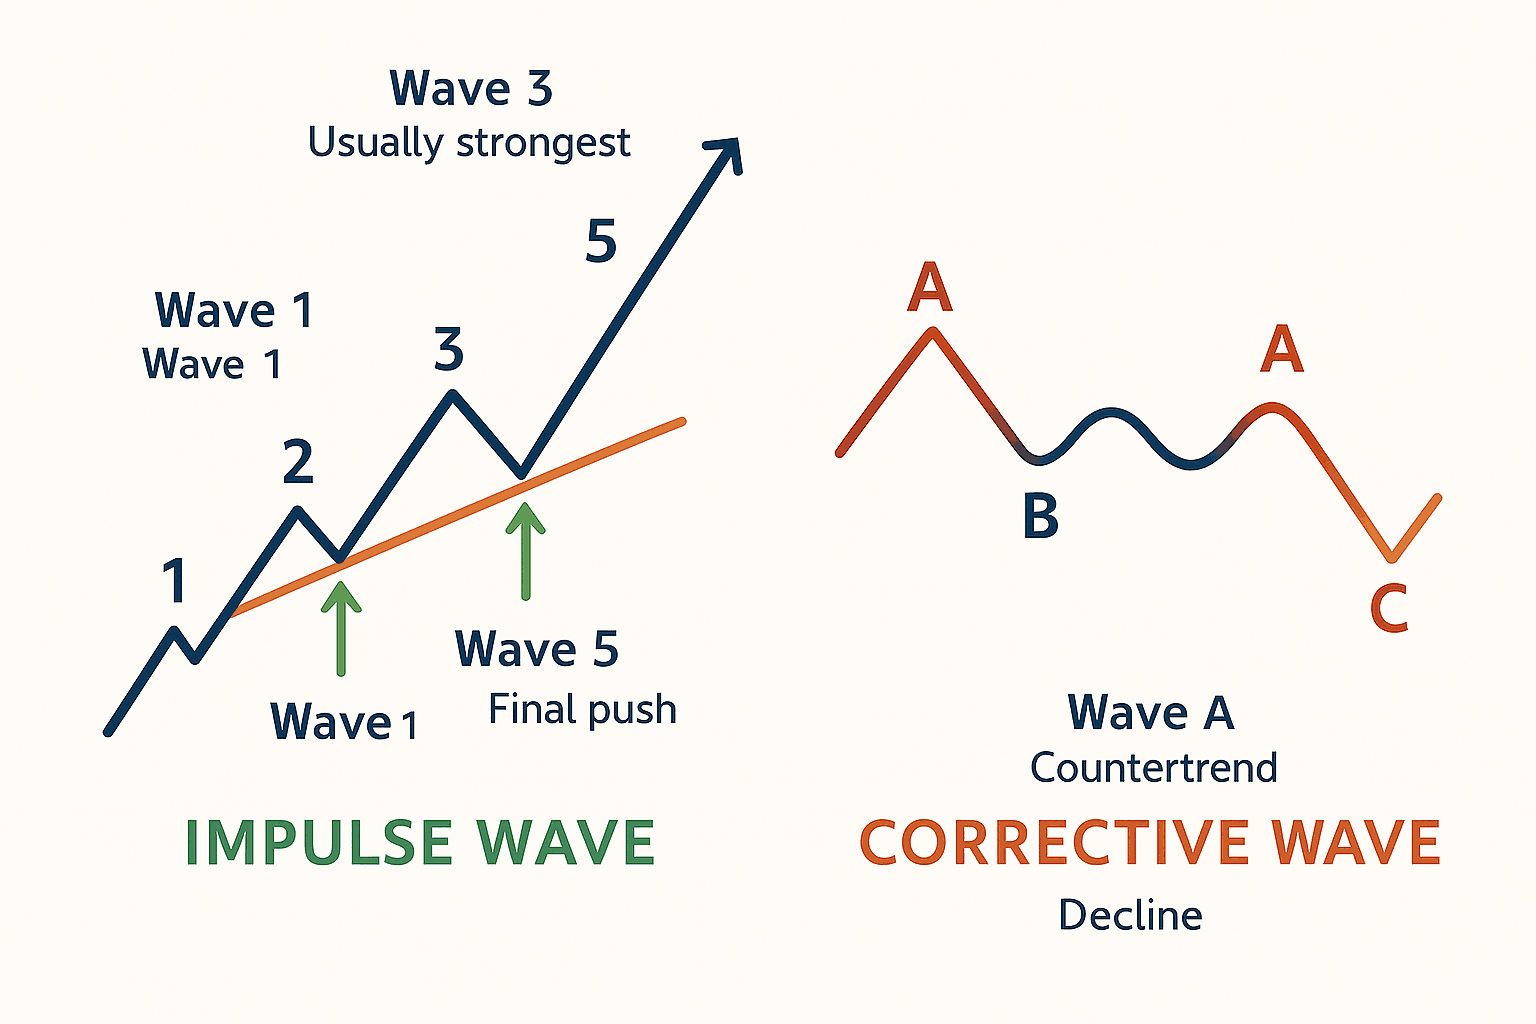
Impulse Wave (1-2-3-4-5):
- Wave 1: The initial move
- Wave 2: A pullback that doesn’t go below the start
- Wave 3: The strongest and longest wave
- Wave 4: Shallow correction
- Wave 5: Final push often weaker than wave 3
Corrective Wave (A-B-C):
- Wave A: First move against trend
- Wave B: Temporary bounce
- Wave C: Final dip before new trend begins
The goal is to identify where you are within this cycle, so you can trade with the trend not against it.
📘 Real-World Application: Spotting Wave 3 Entries
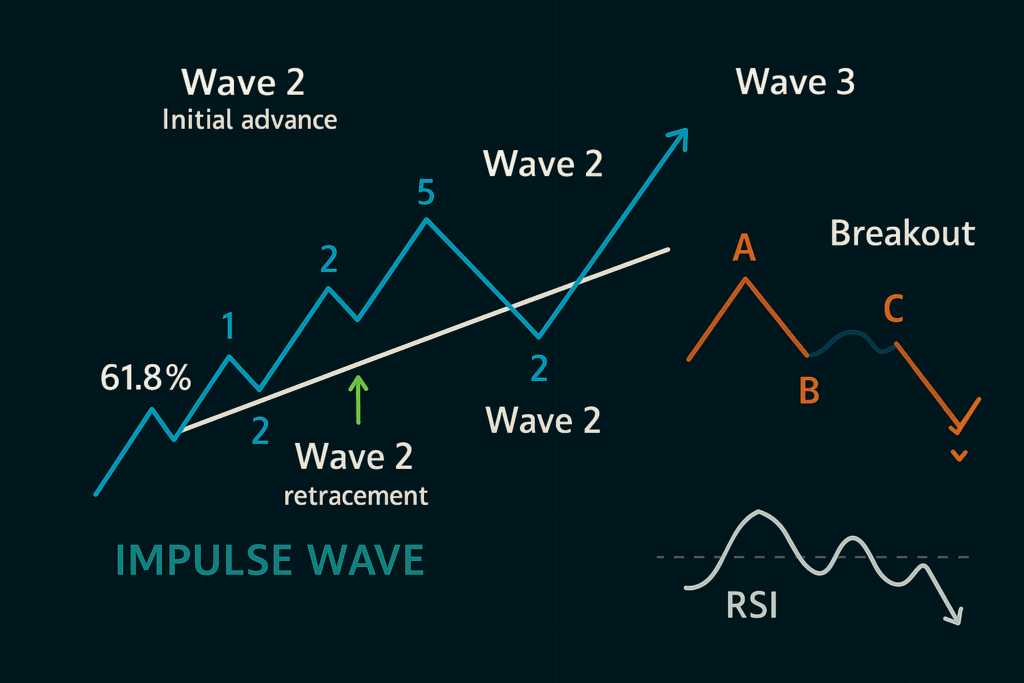
Wave 3 is the money wave it’s where the most explosive movement occurs. Here’s how you can use this in practice:
- Use market structure to identify the start of a new trend (wave 1).
- Wait for a wave 2 pullback into Fibonacci 50%-61.8%.
- Look for confirmation (engulfing candles, divergence, support zone).
- Enter the trade targeting extension zones (e.g., 161.8% Fib) for wave 3.
This is one of the most high-probability entries in Elliott Wave trading.
🎯 When to Use Elliott Wave
- During trend formation: To identify the early impulse wave and ride the move.
- At potential reversal zones: Wave 5 often ends with divergence or exhaustion.
- In consolidations: ABC corrections often end near structural support or resistance.
- With Fibonacci tools: Fib retracements and extensions help measure wave length and targets.
Best of all, waves repeat across timeframes use the higher timeframes to map the big picture, and enter on lower timeframes for precision.
🔧 Tips for Applying Elliott Wave Without Getting Lost
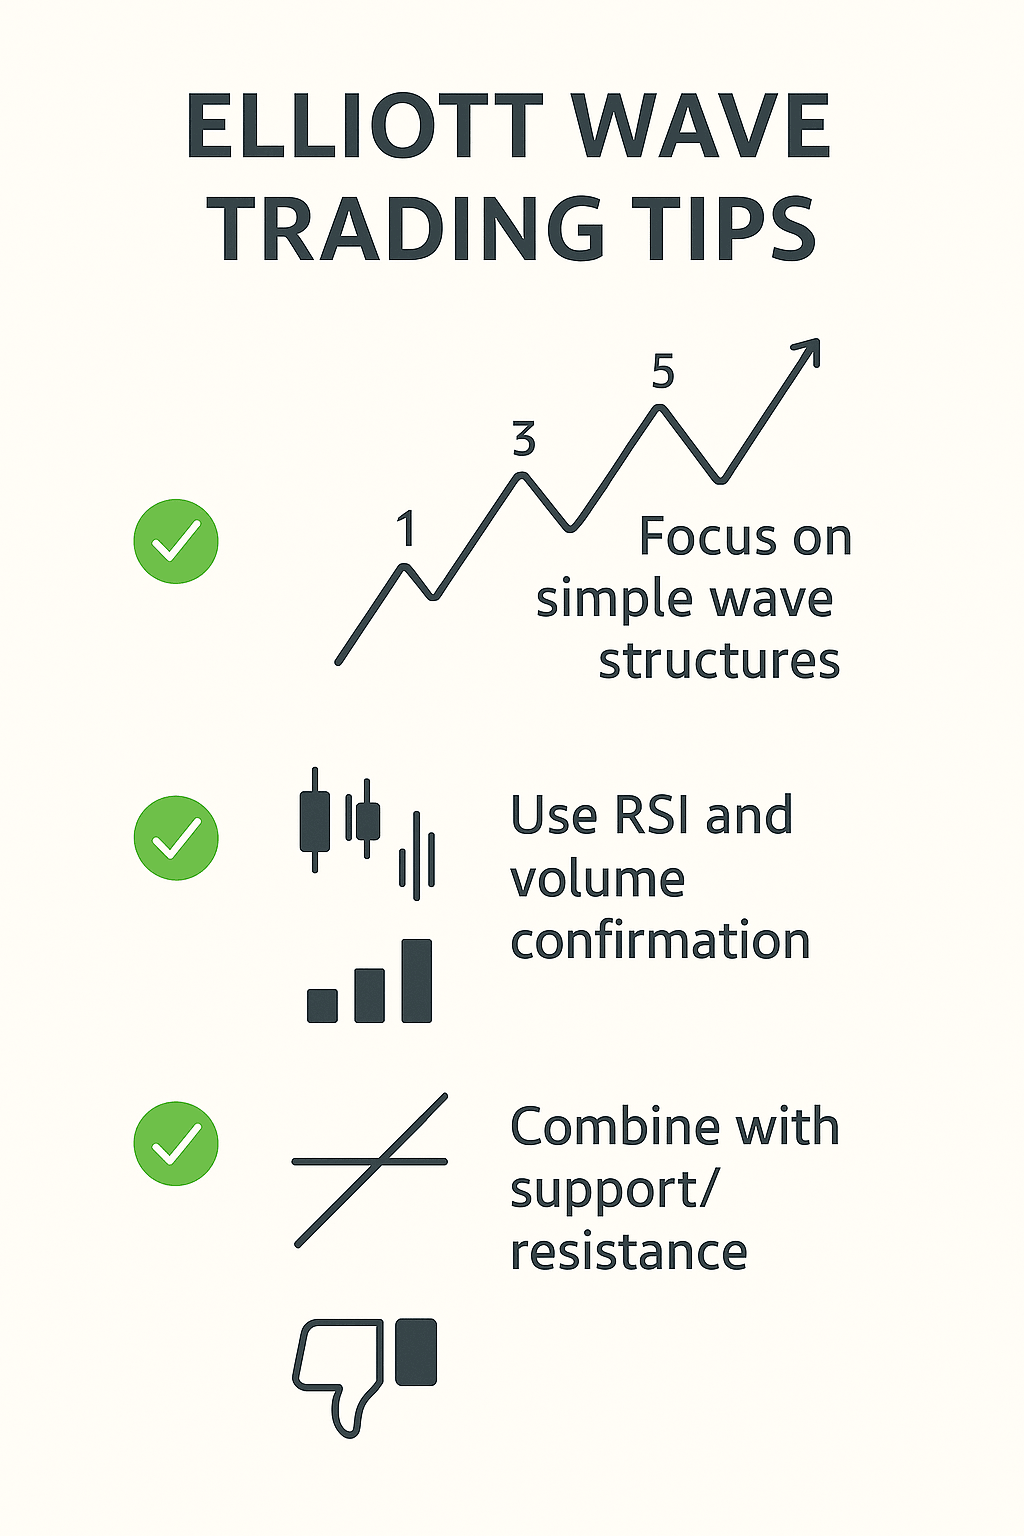
- Keep it simple: Focus on just the impulse and corrective structure at first.
- Use other tools for confirmation: Volume, RSI divergence, and trendlines help validate waves.
- Don’t overlabel: You don’t need perfect wave counts to make good trades.
- Combine with structure: A wave 3 setup near support/resistance is powerful confirmation.
⚠️ Common Pitfalls
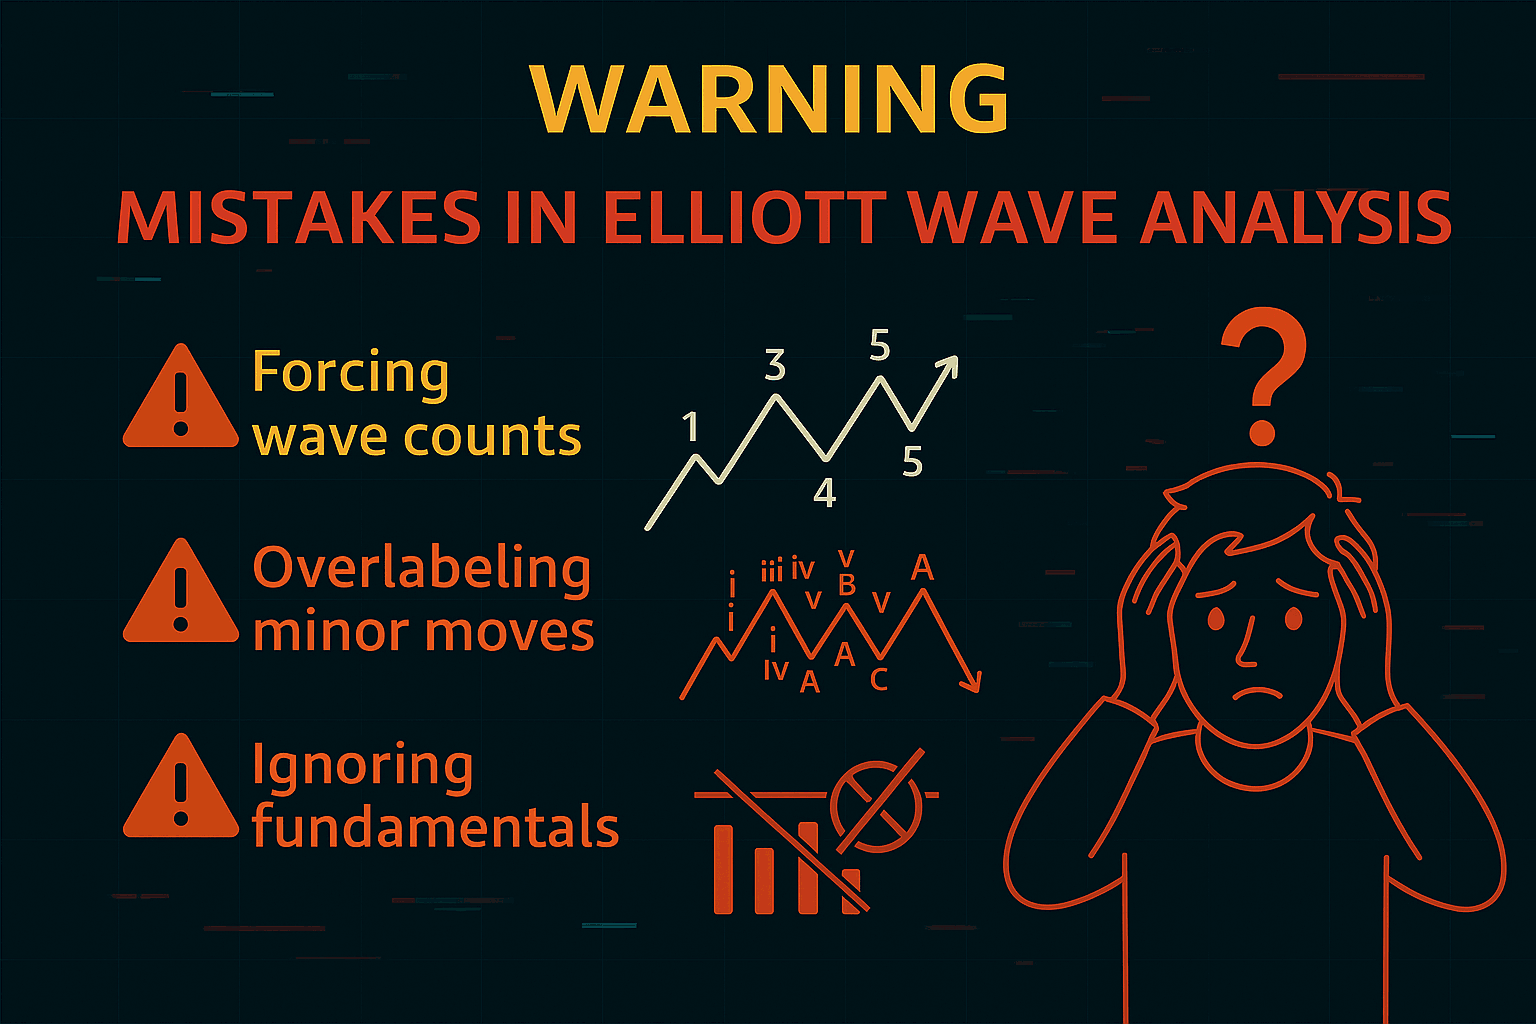
- Forcing wave counts where none exist
- Labeling minor moves as full cycles
- Ignoring fundamentals and structure
- Using Elliott Wave as your only decision-making tool
Remember: it’s a framework, not a crystal ball.
🧭 Final Thoughts
Elliott Wave Theory isn’t about being perfect it’s about seeing the rhythm behind the chaos. Once you get comfortable identifying waves and applying basic rules, you’ll start seeing the hidden structure of price movement in a whole new way.
Combine Elliott Wave with other tools like Fibonacci, support/resistance, and volume and you’ve got a strategy that gives you context, timing, and conviction.