
🧠 Introduction: Spotting What Others Miss
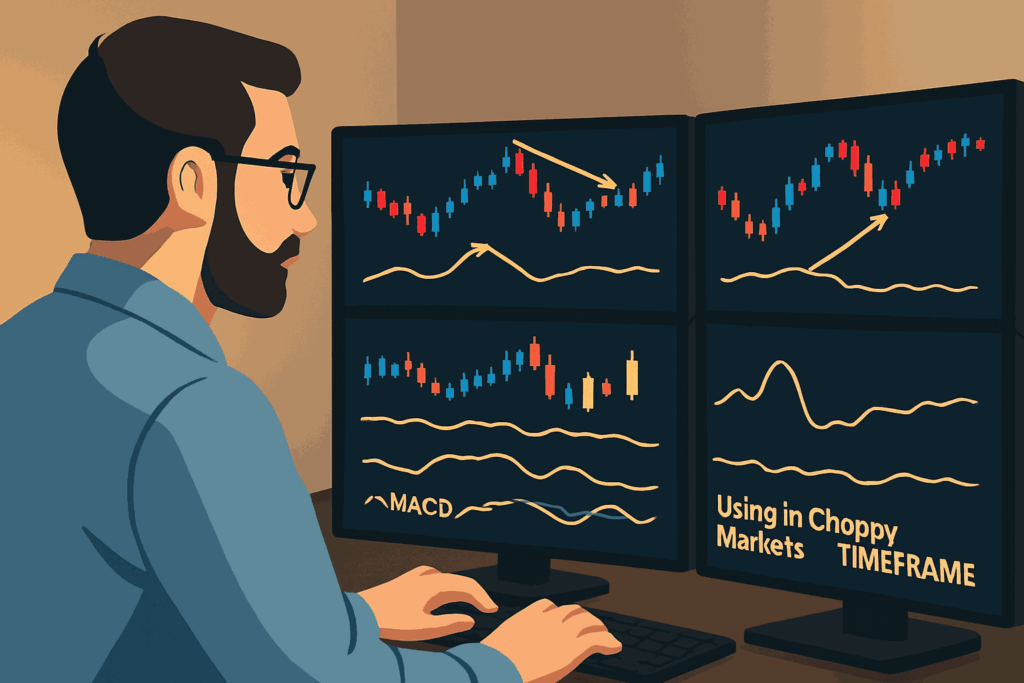
Markets don’t reverse randomly they leave clues. One of the most reliable signals that a trend is about to slow down or reverse is Mastering divergence. And two of the best tools to spot it? RSI (Relative Strength Index) and MACD (Moving Average Convergence Divergence).
Divergence helps you identify hidden weakness in a trend or potential early entry points before the crowd reacts. This article will teach you how to spot divergence using RSI and MACD and how to turn those signals into precision trades.
🔍 What is Divergence?
Divergence occurs when the price of an asset moves in the opposite direction of an indicator. It’s a warning that momentum is fading even if price is still pushing in the same direction.
There are two main types:
- Regular Divergence – signals potential reversals.
- Hidden Divergence – signals potential trend continuation.
Think of it like this: the price is trying to go higher, but the engine (momentum) is running out of fuel.
⚙️ RSI vs. MACD: What’s the Difference?
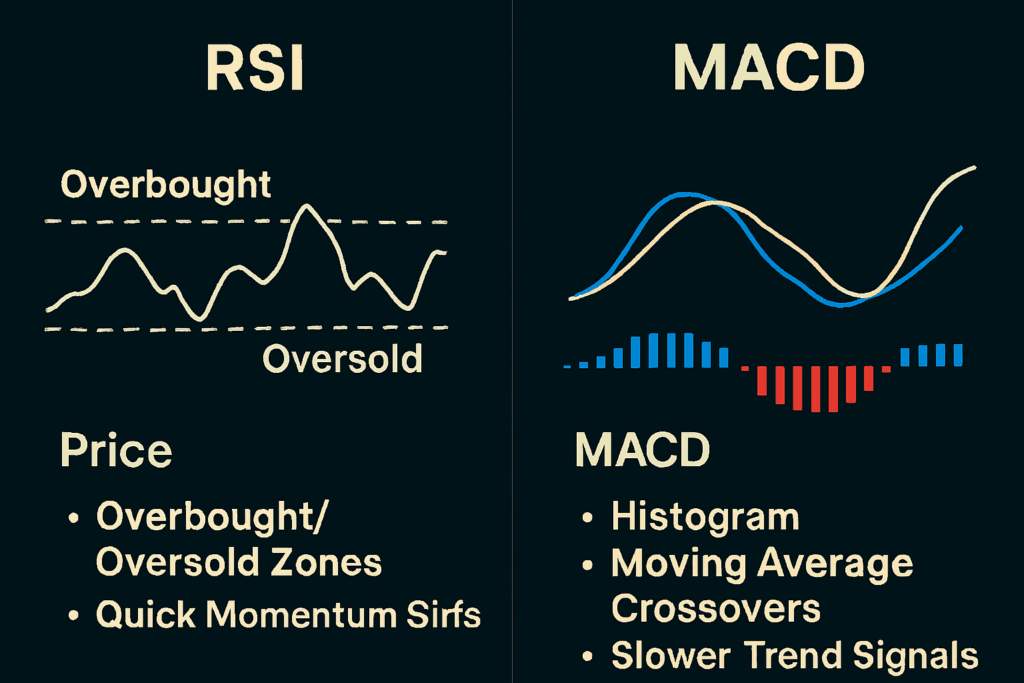
RSI (Relative Strength Index):
- Measures overbought and oversold conditions.
- Great for spotting short-term shifts in momentum.
- Ideal for faster divergence signals.
MACD (Moving Average Convergence Divergence):
- Combines moving averages to show trend strength and momentum.
- Slower but more reliable on higher timeframes.
- Ideal for swing trading divergence setups.
Both indicators can be used separately but using them together provides stronger confirmation.
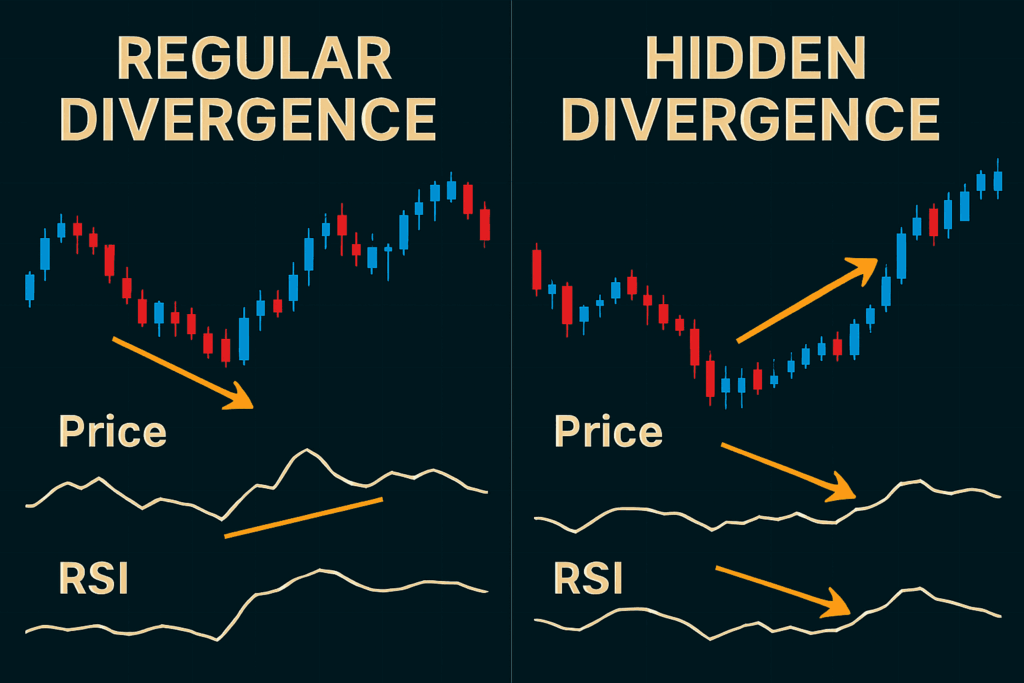
🔁 Regular Divergence: The Reversal Signal
Bullish Regular Divergence:
- Price makes lower lows
- RSI/MACD makes higher lows
- Signal: Momentum is weakening look for a reversal upward.
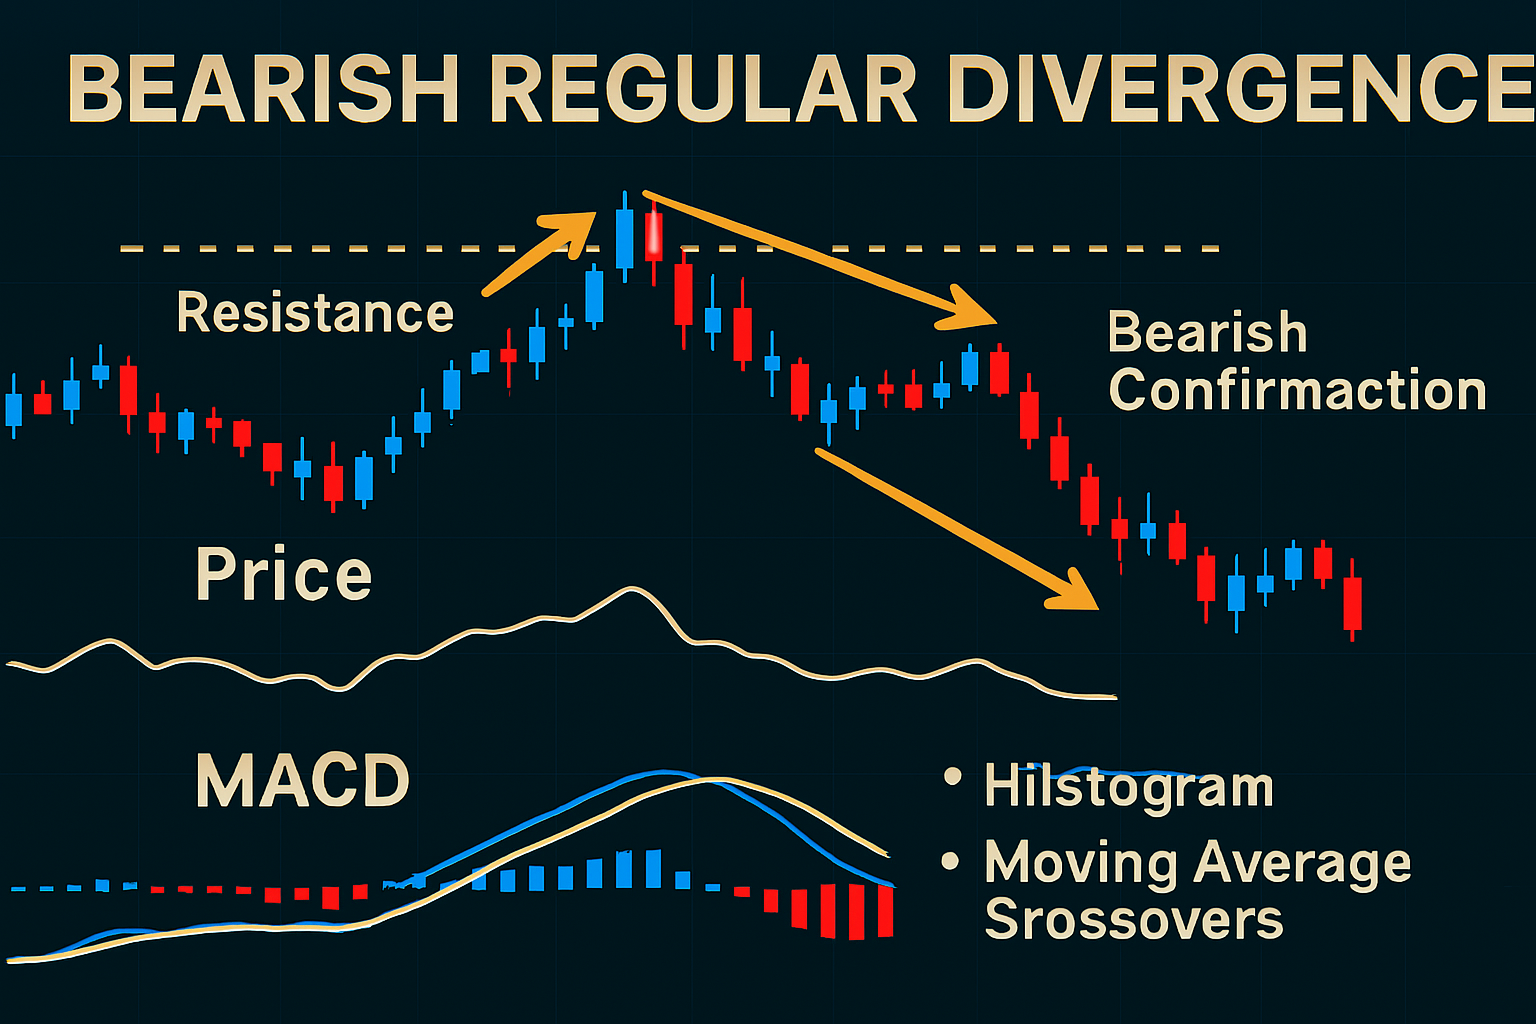
Bearish Regular Divergence:
- Price makes higher highs
- RSI/MACD makes lower highs
- Signal: Trend is tiring look for a reversal downward.
This setup often appears near key support or resistance zones and works well when confirmed with candlestick patterns or volume drops.
🔁 Hidden Divergence: The Continuation Clue

Bullish Hidden Divergence:
- Price makes higher lows
- RSI/MACD makes lower lows
- Signal: Trend still has fuel consider entering on pullbacks.
Bearish Hidden Divergence:
- Price makes lower highs
- RSI/MACD makes higher highs
- Signal: Downtrend likely to continue join the trend.
Hidden divergence is subtle but powerful, especially when combined with market structure and trendline retests.
🎯 Trade Example: MACD Divergence on EUR/USD
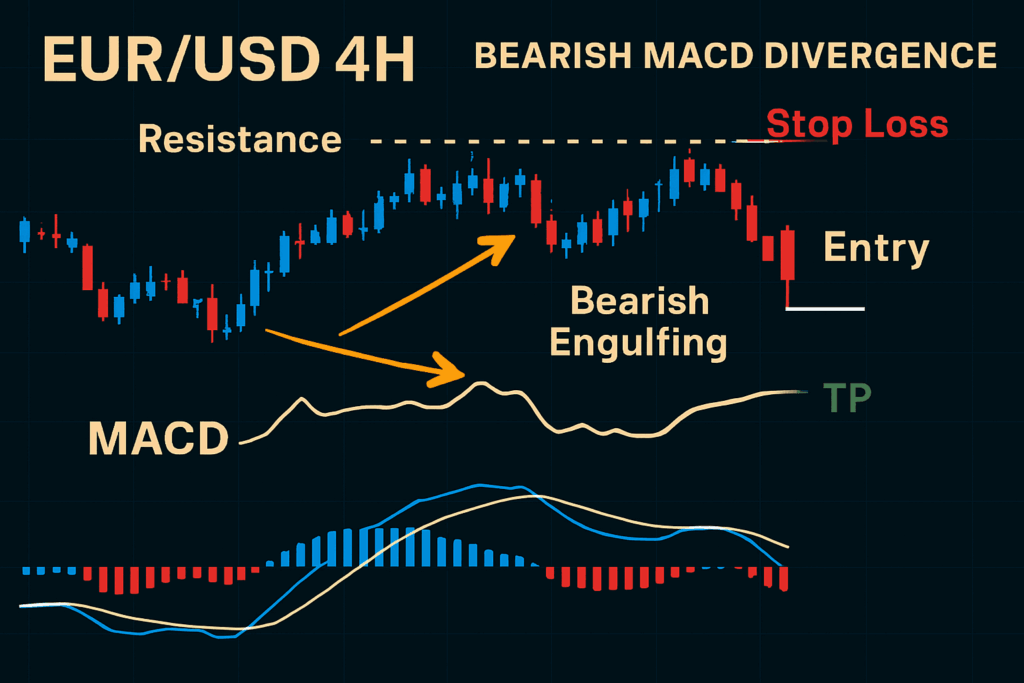
- EUR/USD forms higher highs on the 4H chart.
- MACD histogram shows lower highs classic bearish divergence.
- Price enters resistance zone and forms a bearish engulfing candle.
- You enter short with stop above the high and TP at next support zone.
This is a textbook setup: divergence + structure + price action.
🔑 How to Trade Divergence Like a Pro
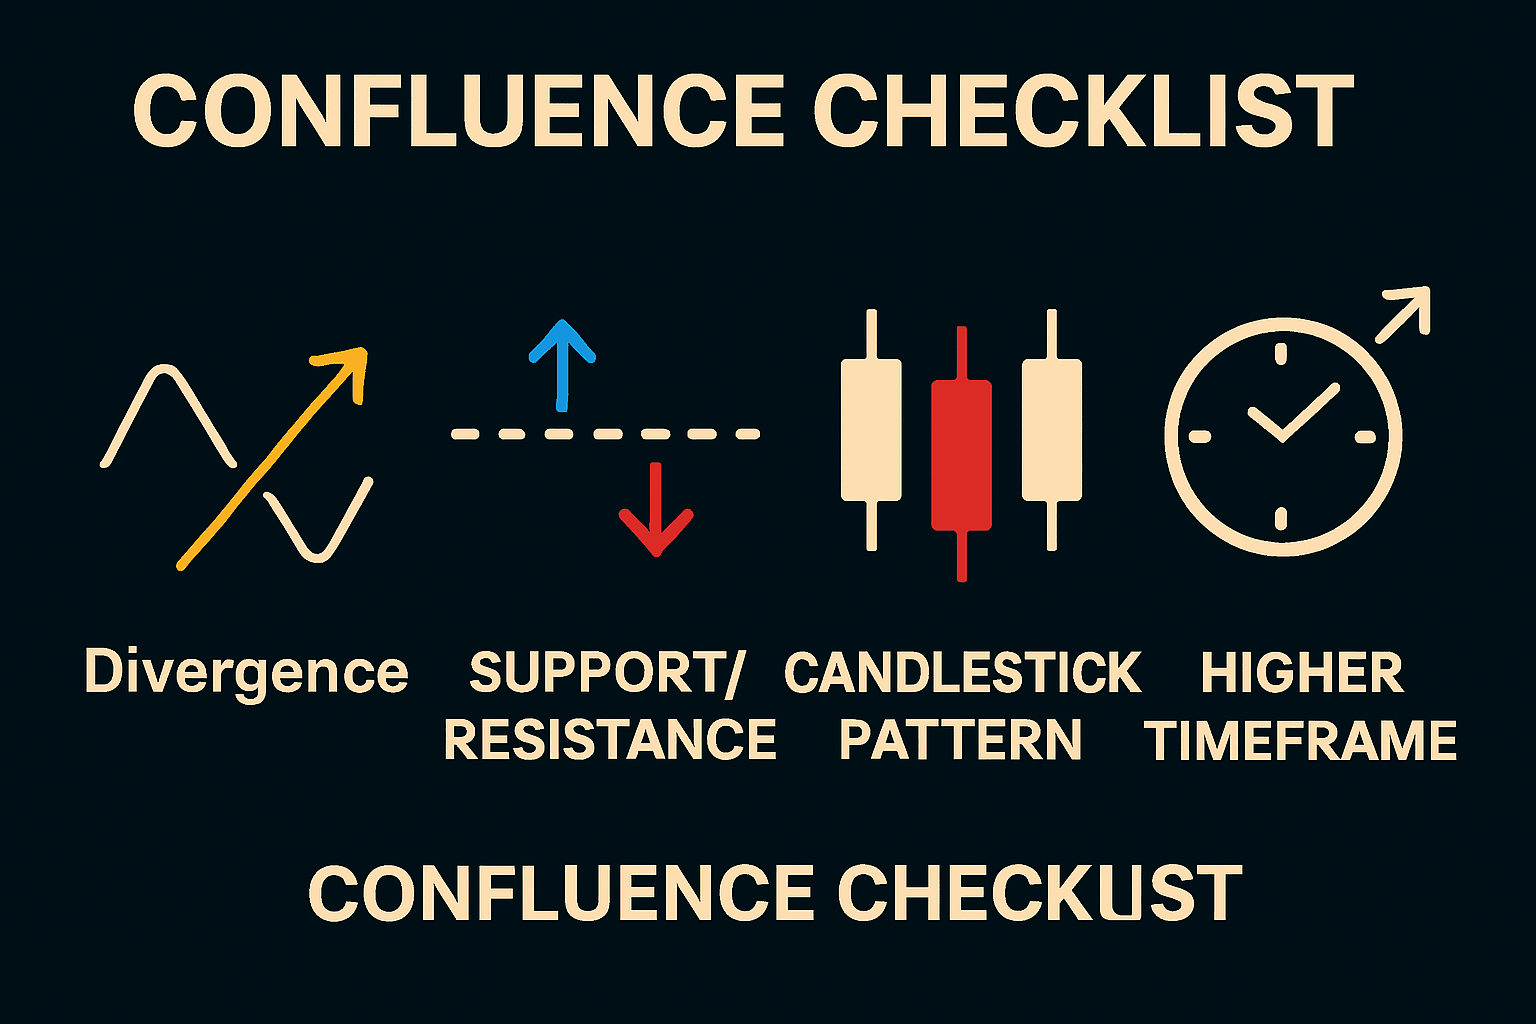
- Use divergence as confluence, not the sole reason to trade.
- Combine it with:
- Support/resistance zones
- Supply/demand levels
- Candlestick confirmation
- Apply it on higher timeframes (1H, 4H, Daily) for stronger signals.
- Wait for price confirmation don’t enter just because you see divergence.
⚠️ Mistakes to Avoid
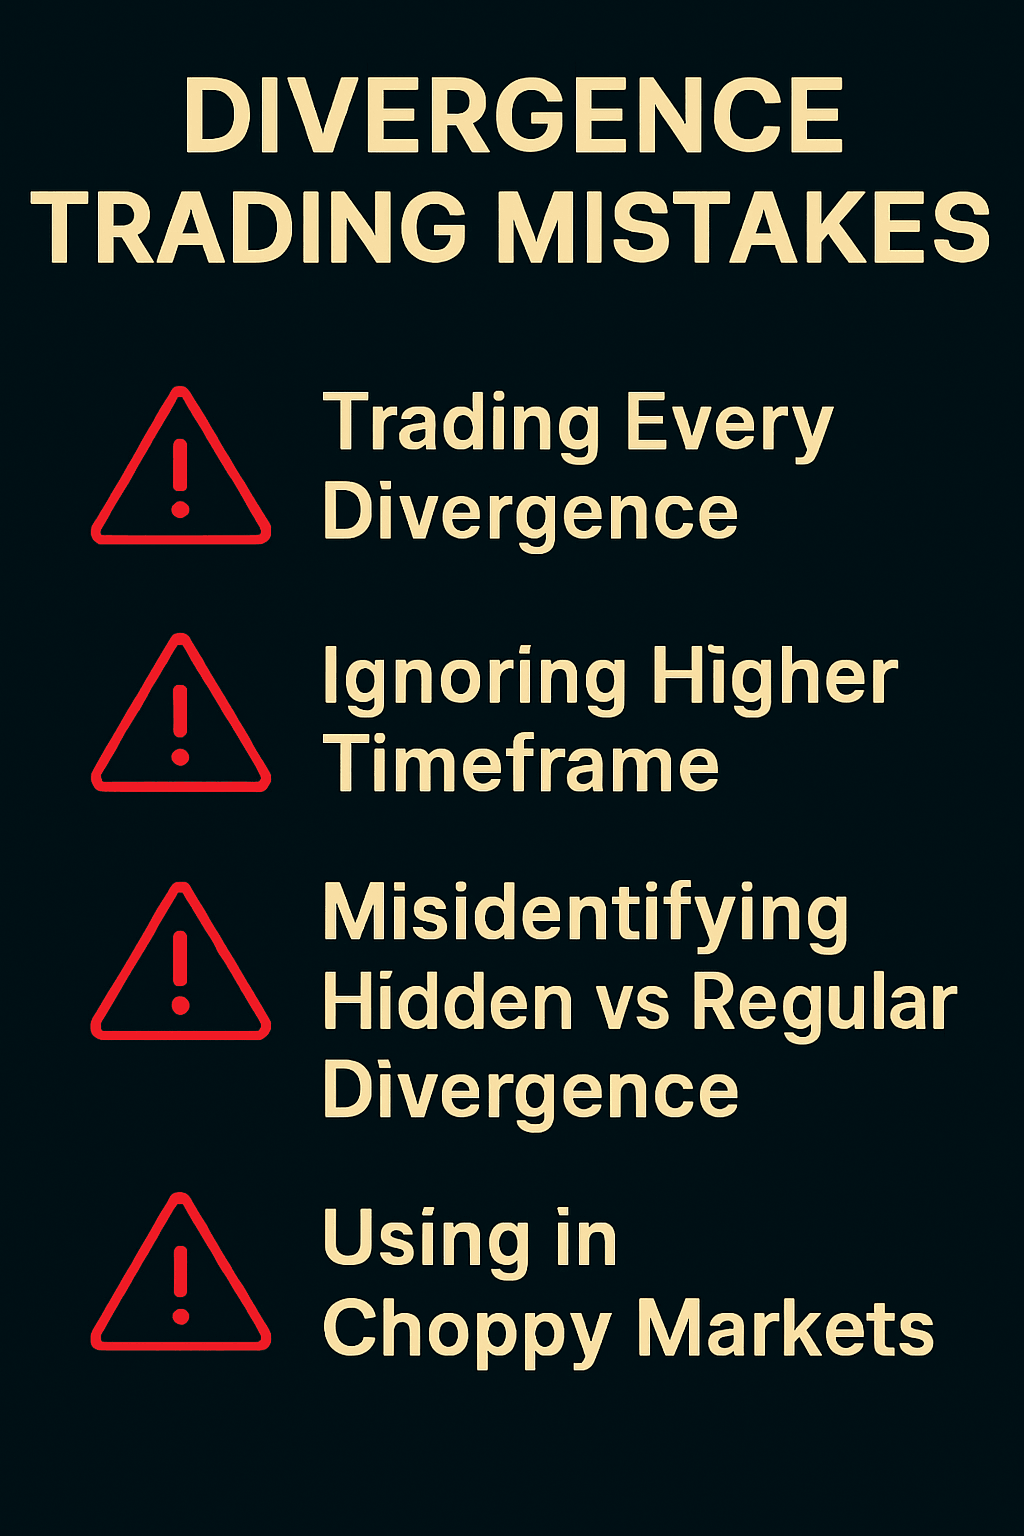
- Trading divergence blindly on every small move.
- Using divergence in choppy, sideways markets it works best in clear trends.
- Confusing hidden and regular divergence.
- Ignoring higher timeframes context matters.
🧭 Final Thoughts
Divergence is one of the most powerful tools in a trader’s arsenal but only when used correctly. When RSI or MACD tells a different story than price, it’s a signal worth paying attention to. Combine it with strong technical zones, clean price action, and disciplined execution, and you’ll catch moves others never saw coming.