🧠 Introduction: Precision Meets Structure
Fibonacci levels are powerful but only when combined with real market context. Many traders misuse Fibonacci tools like a magic wand, drawing random retracements and hoping for miracles. The truth is: Fibonacci tools only work when anchored in strong market structure.
This guide will walk you through how to build your own advanced strategy using the synergy of Fibonacci levels and price structure—not indicators, not guesswork just raw technical precision.
🔍 Why Combine Fibonacci and Market Structure?
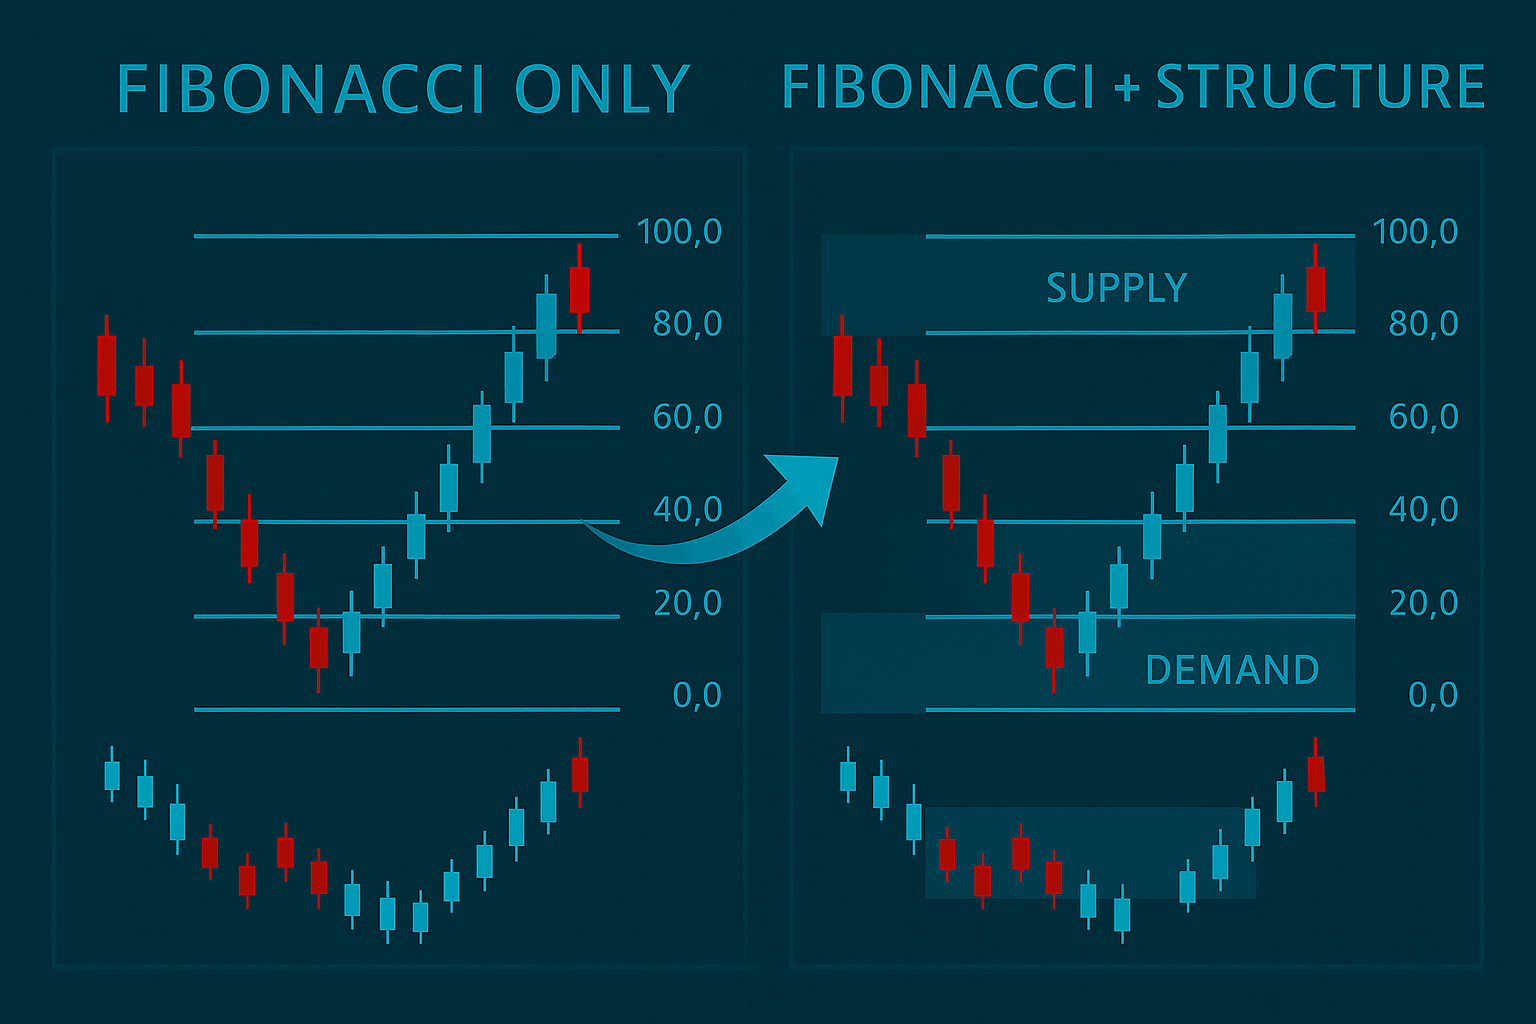
Fibonacci retracements highlight potential reversal zones, while market structure tells you when and where price is likely to react. When both align, it forms a high-probability trading zone backed by logic, not luck.
Benefits of combining them:
- More accurate entries and exits
- Clear invalidation levels
- Objective trade planning
- Built-in risk management through structural context
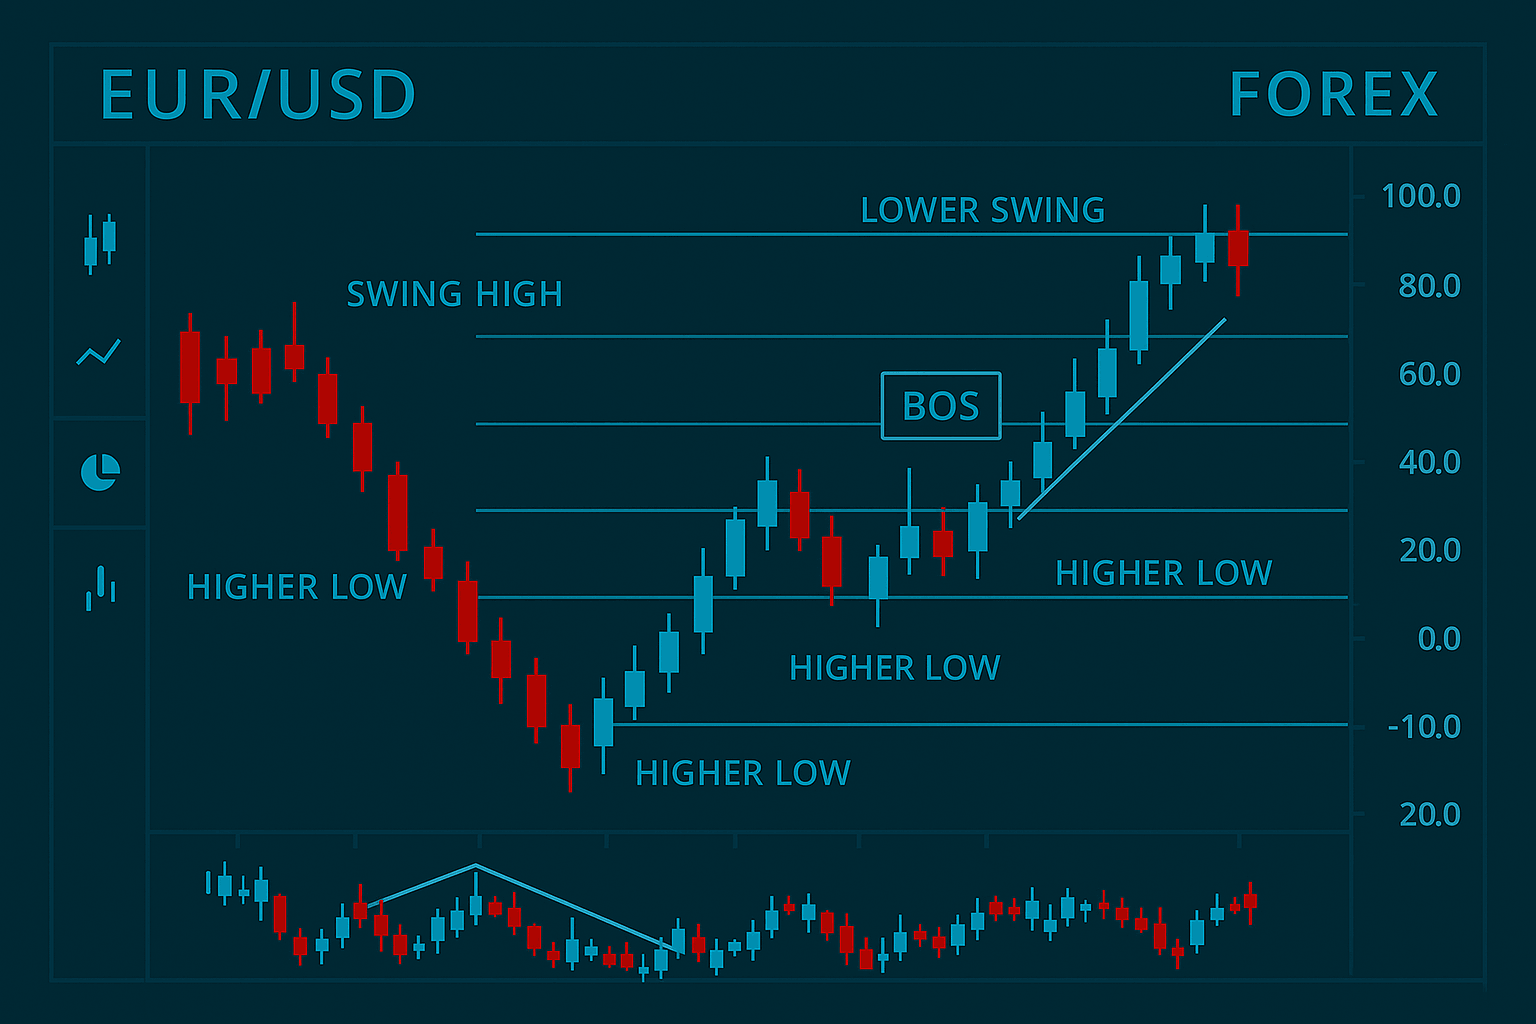
🏗 Step 1: Understand the Market Structure First
Before you even touch the Fibonacci tool, identify the key elements of structure:
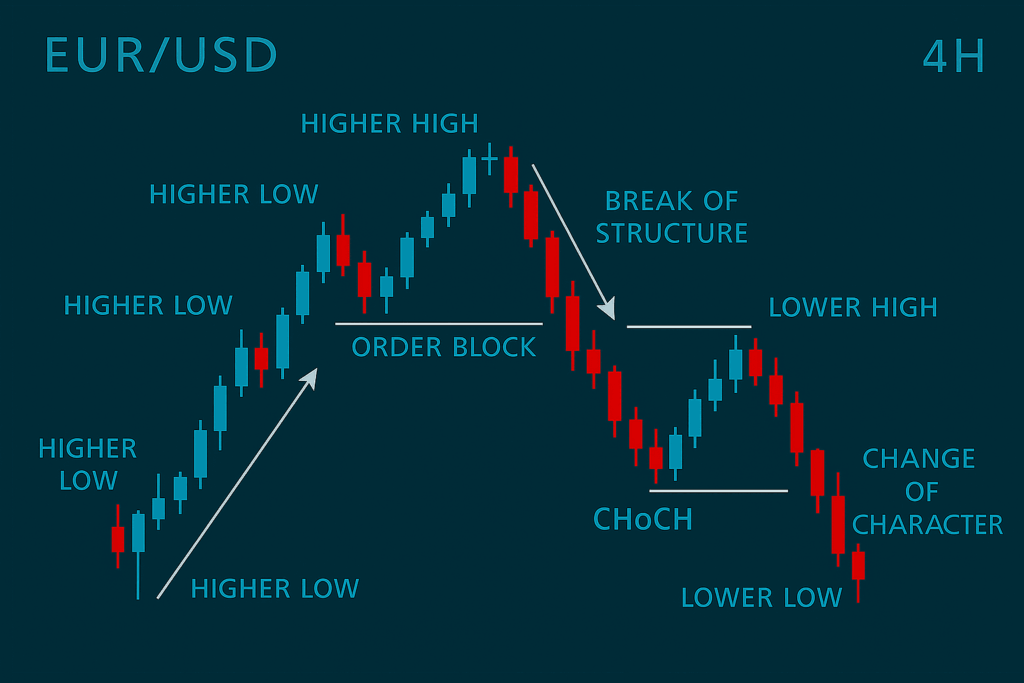
- Trend direction (higher highs/lows for uptrend, lower highs/lows for downtrend)
- Recent swing points (impulses and corrections)
- Breaks of structure (BOS) and change of character (CHOCH)
- Support and resistance zones or order blocks
You need to know where the market is flowing before trying to measure pullbacks.
📐 Step 2: Plot Fibonacci Retracement Correctly
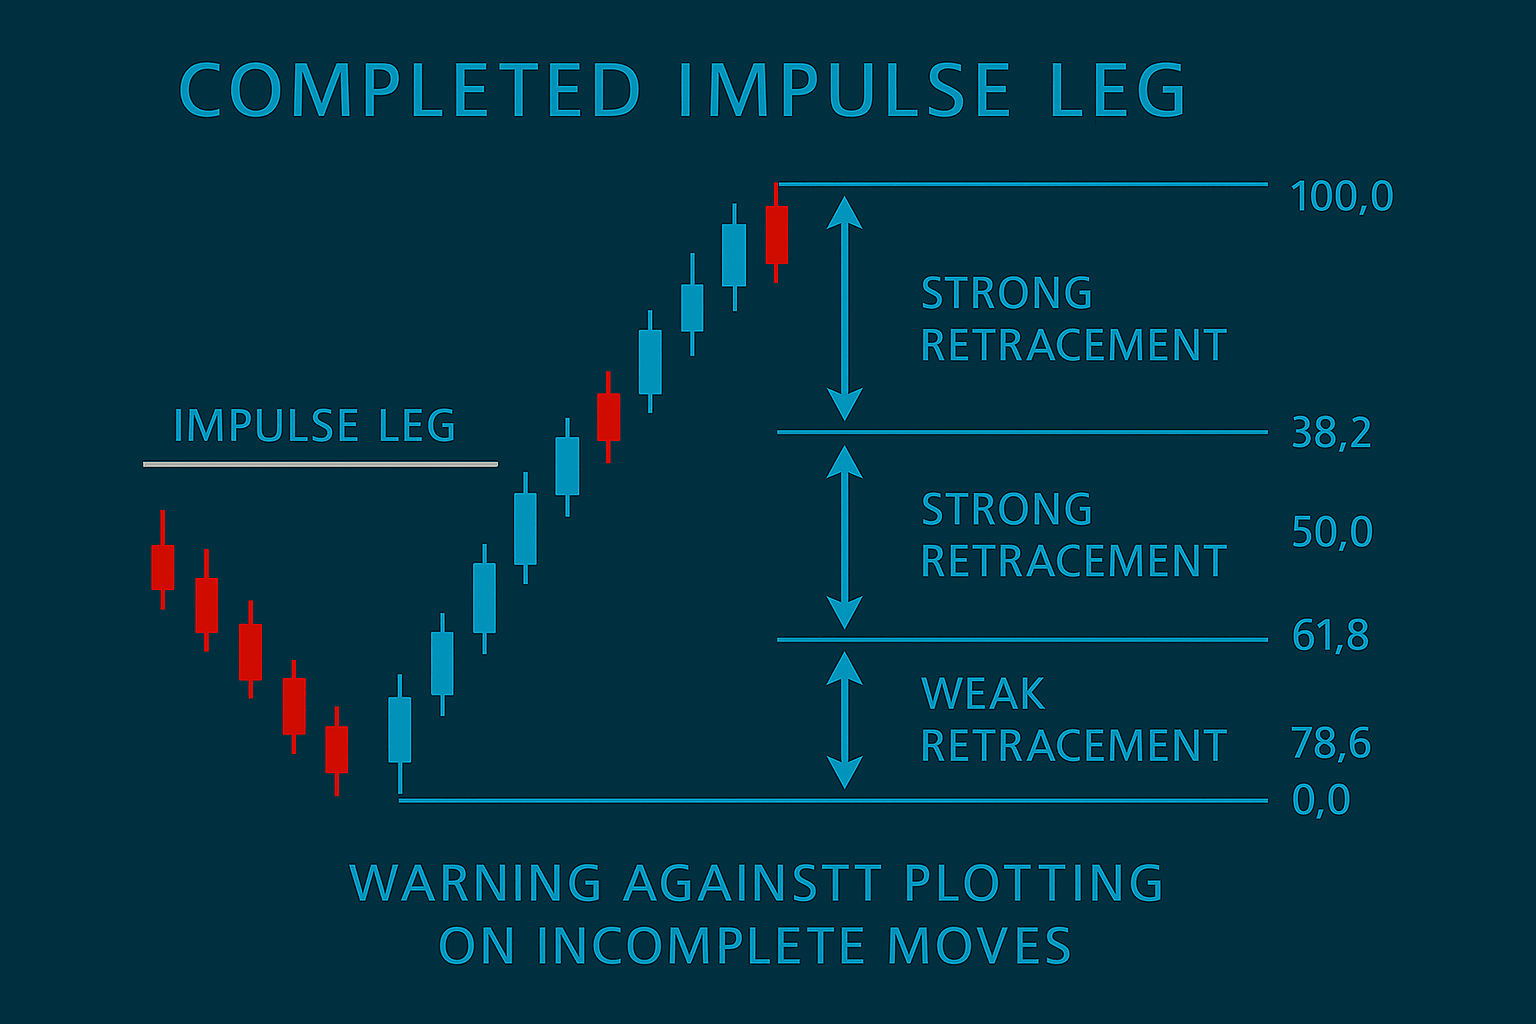
Only draw Fibonacci retracements from confirmed swing highs to swing lows (or vice versa). Avoid plotting during active candles or incomplete moves.
Common retracement levels to watch:
- 38.2% – shallow retracement, momentum still strong
- 50% – psychological midpoint
- 61.8% – golden ratio, most reactive zone
- 78.6% – deep retracement, high reward/risk but higher risk of invalidation
Plot your Fibs after a completed impulse, then wait for price to retrace into one of the levels within structure.
🎯 Step 3: Combine With Market Structure Zones
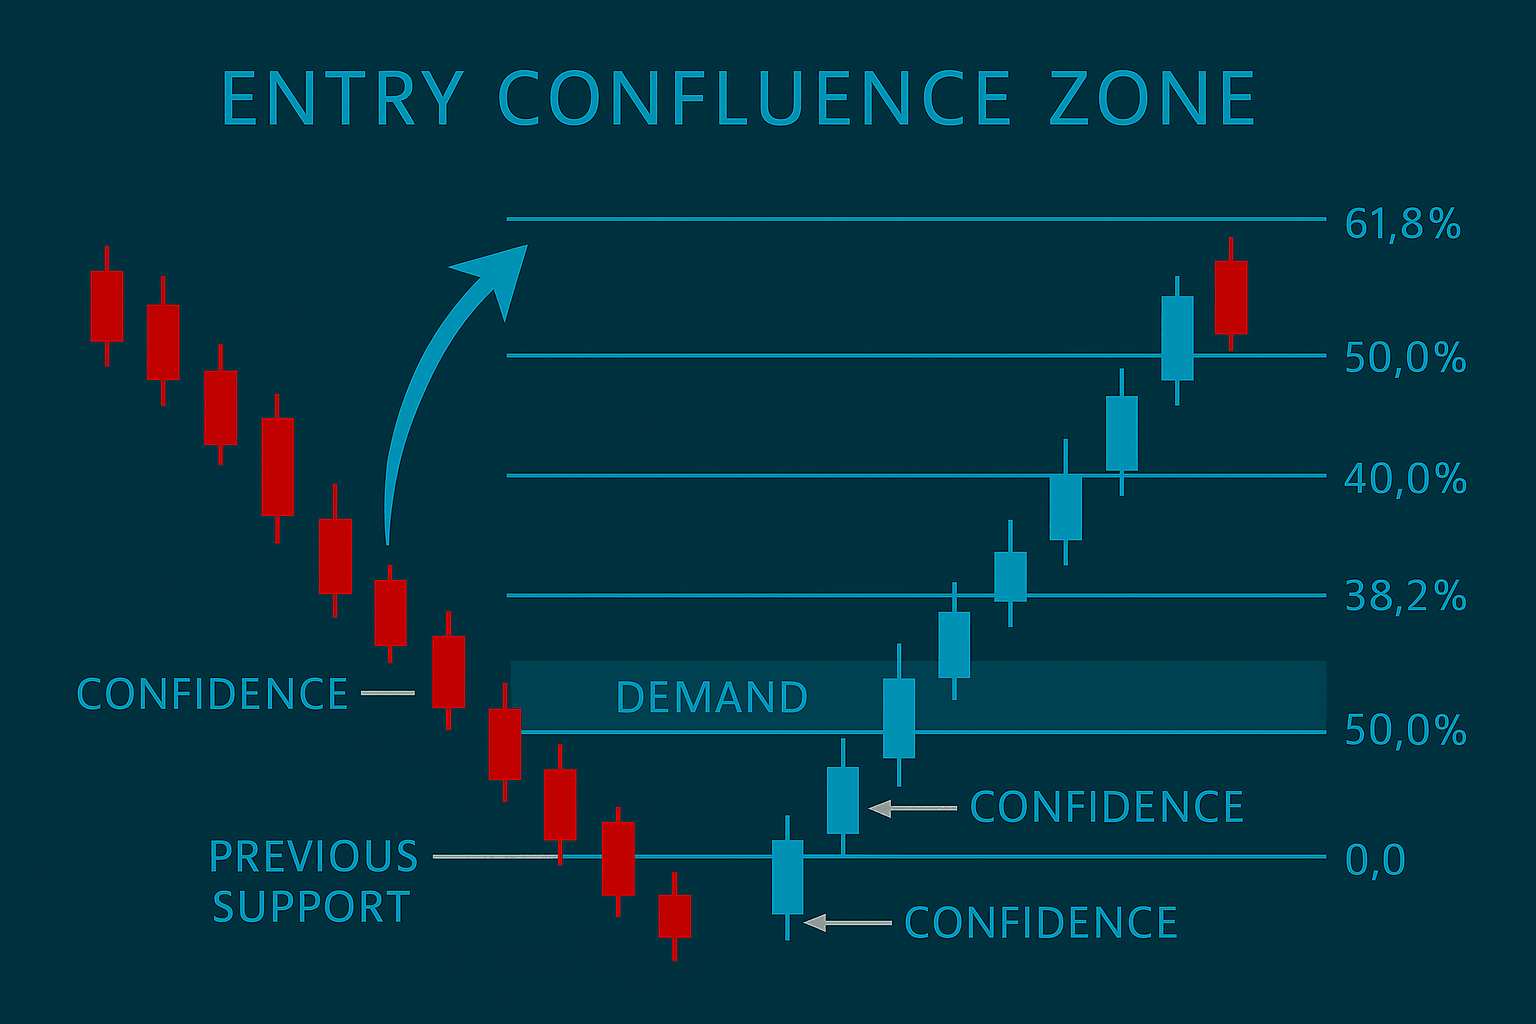
Let’s say price breaks structure upward, creating a new high. You plot the Fibonacci retracement on the impulse leg.
Now observe:
- Does the 50%-61.8% zone align with a previous support, order block, or fair value gap?
- Is price retracing into a demand zone while also hitting the 61.8% Fib level?
- Do you see bullish candles forming in that area?
That’s your entry confluence zone – a hallmark of professional setups.
🔥 Entry and Exit Planning
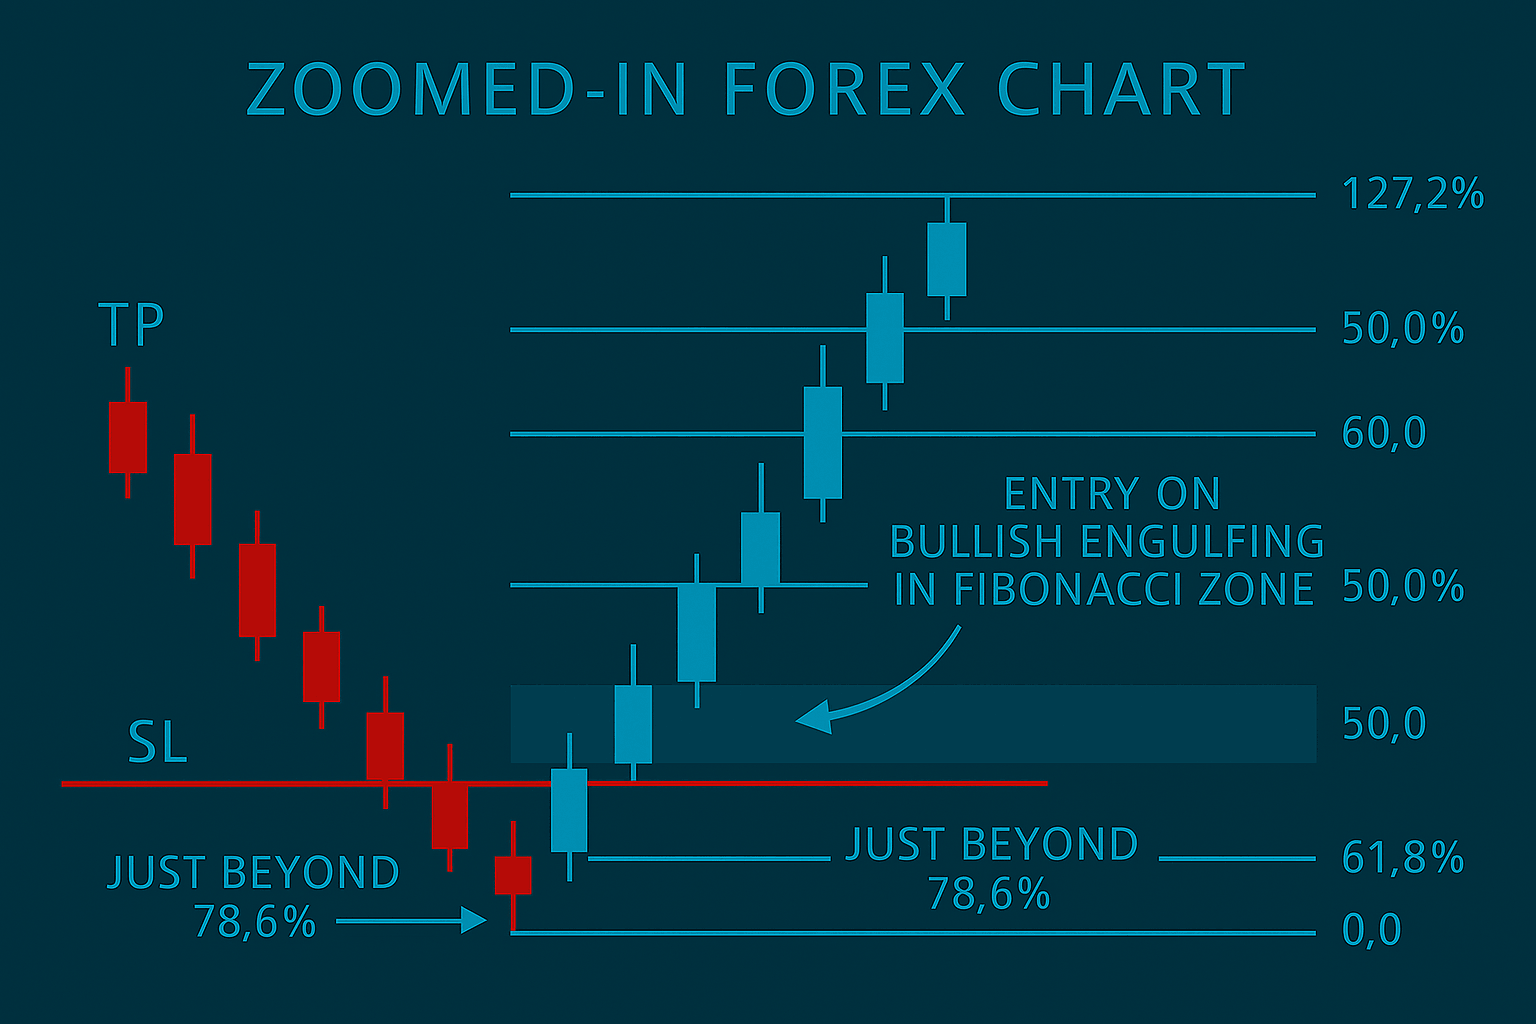
- Entry trigger: Wait for confirmation like bullish engulfing, inside bars, or pin bars in the confluence zone (Fibonacci + structure).
- Stop-loss: Just below/above the structural low/high and slightly beyond the 78.6% level to avoid premature exits.
- Target 1: The most recent swing high/low.
- Target 2: Fibonacci extension levels like 127.2% or 161.8% if trend continuation is expected.
Want help with planning exits? Learn how to avoid emotional exits and profit sniping.
📘 Example Setup: EUR/USD Long Trade
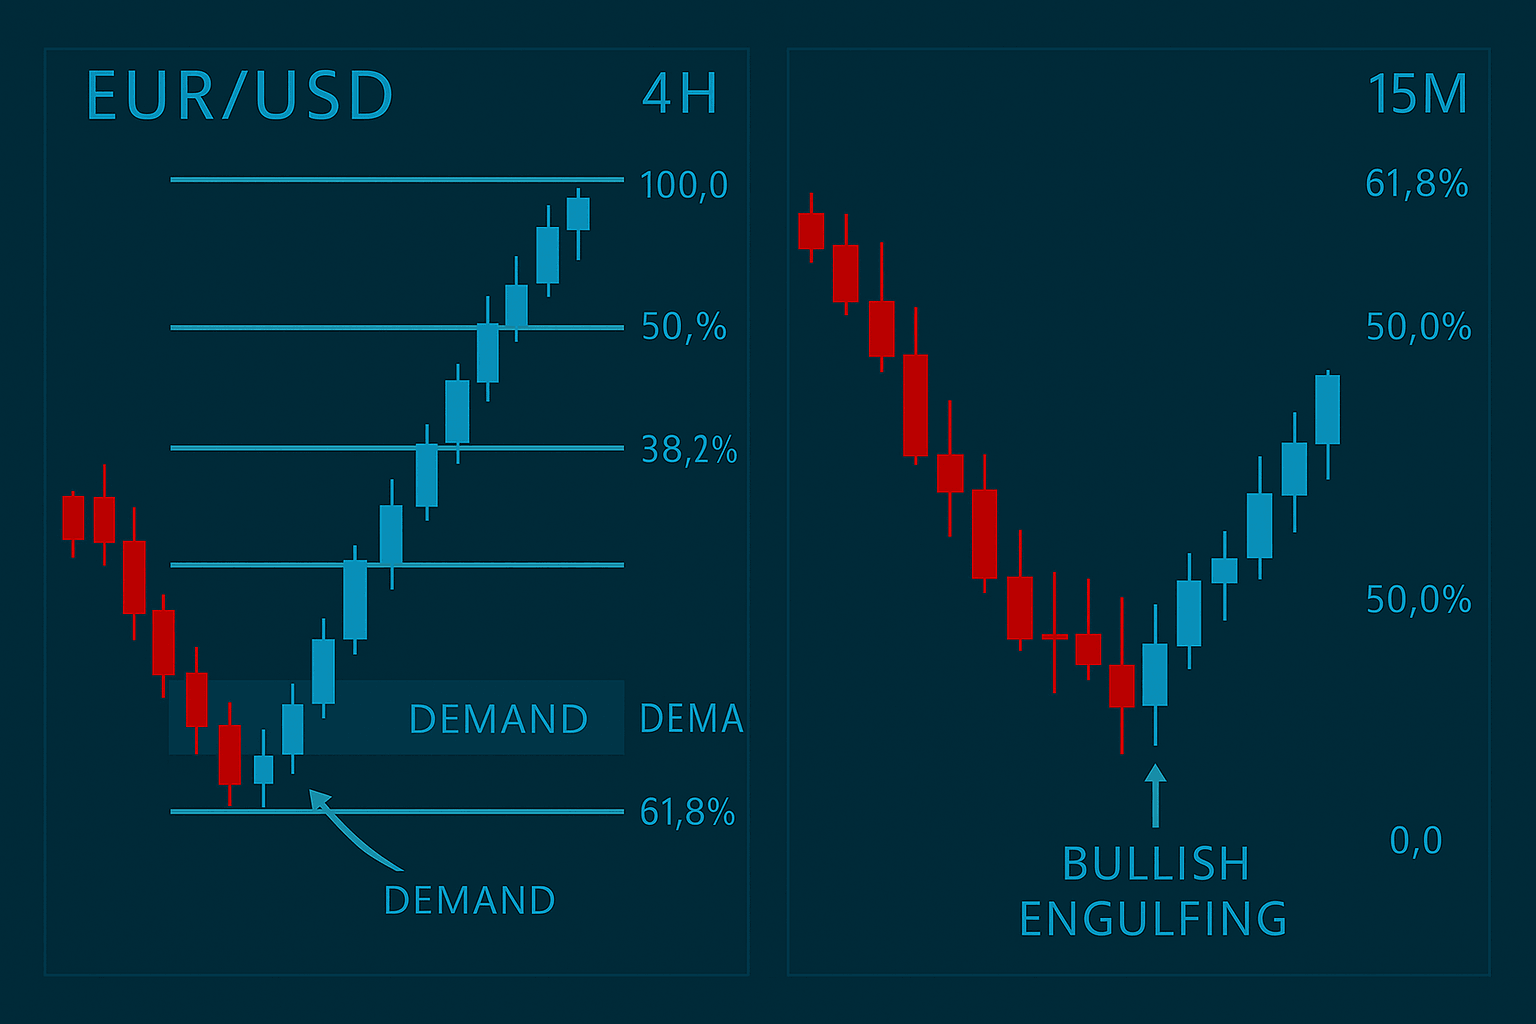
- Price breaks above structure on the 4H chart.
- You draw Fibonacci from the swing low to swing high.
- Price pulls back to the 61.8% level, which aligns with a previous demand zone.
- On the 15M chart, a bullish engulfing candle forms in the confluence zone.
Result:
High-probability long trade with tight risk and logical TP based on structure.
⚠️ Common Pitfalls to Avoid
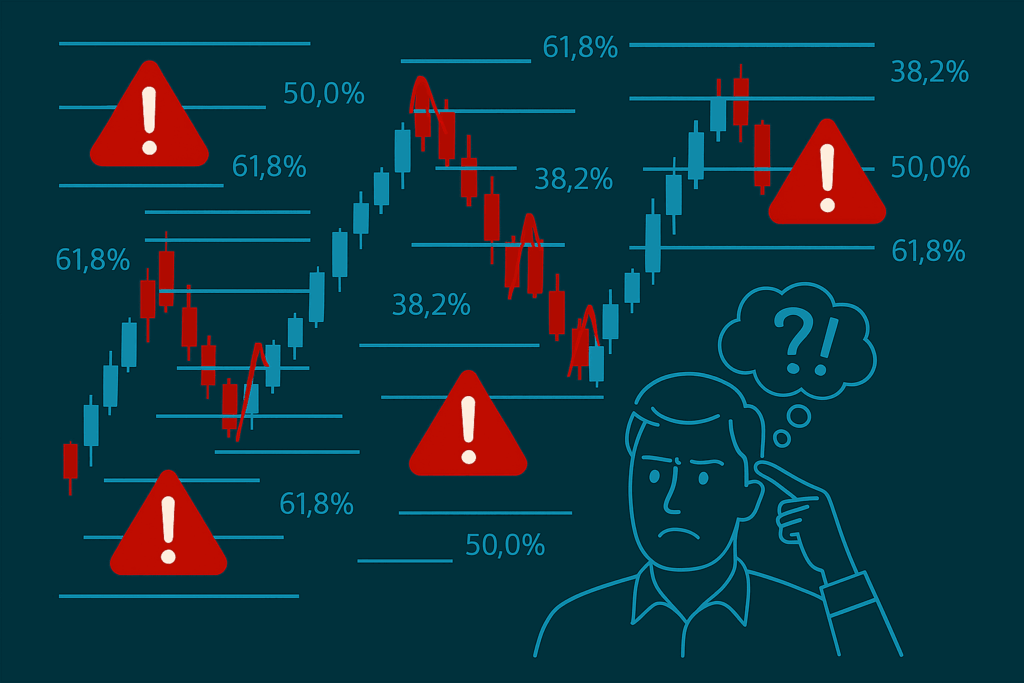
- Forcing Fibonacci tools on random points
- Ignoring overall trend and structure
- Entering blindly at Fib levels without price action confirmation
- Not adjusting the Fib after new structure breaks
- Using too many tools—keep it clean and focused
🧭 Final Thoughts
Fibonacci tools alone aren’t magical but when combined with market structure, they become a sniper’s tool. You’re no longer just drawing levels you’re building a customized strategy based on logic, timing, and confluence.
Test it, tweak it, and make it your own. That’s how real traders evolve from strategy followers to strategy creators.