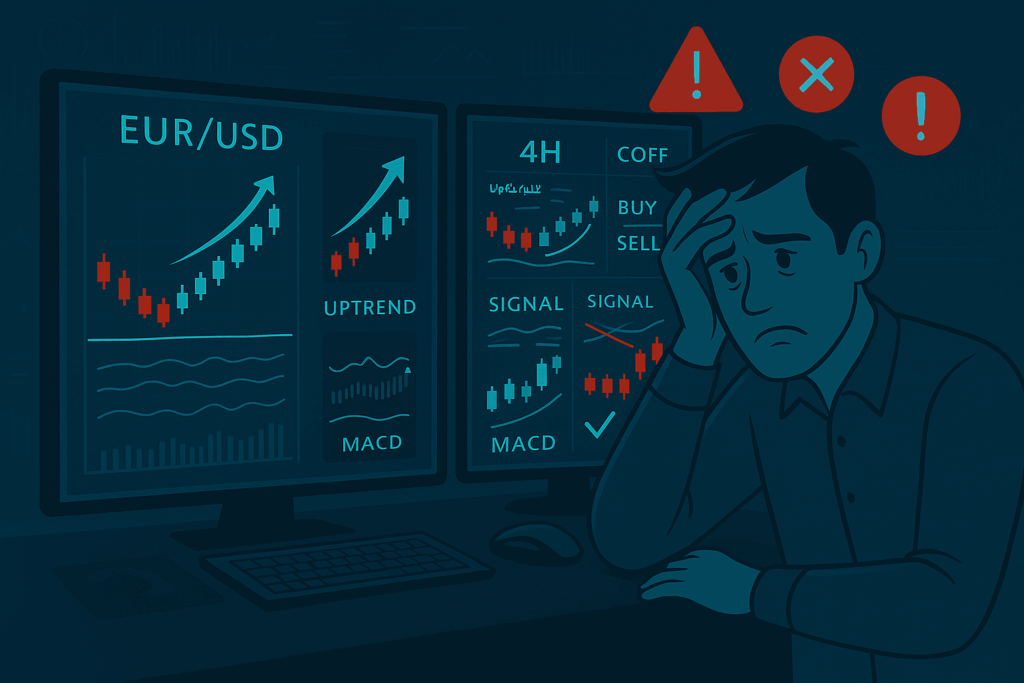
🧠 Introduction: Why Single-Timeframe Analysis Isn’t Enough
Many traders limit their analysis to a single timeframe like the 15-minute or 4-hour chart and wonder why their trades keep missing the mark. The reality is: price action behaves differently depending on the lens you use. That’s where multi-timeframe confluence comes in. By combining signals from multiple chart timeframes, you drastically improve your entry accuracy and reduce the noise.
This article will break down how to use multi-timeframe analysis to master high-precision entries just like the pros.
🧩 What is Multi-Timeframe Confluence?
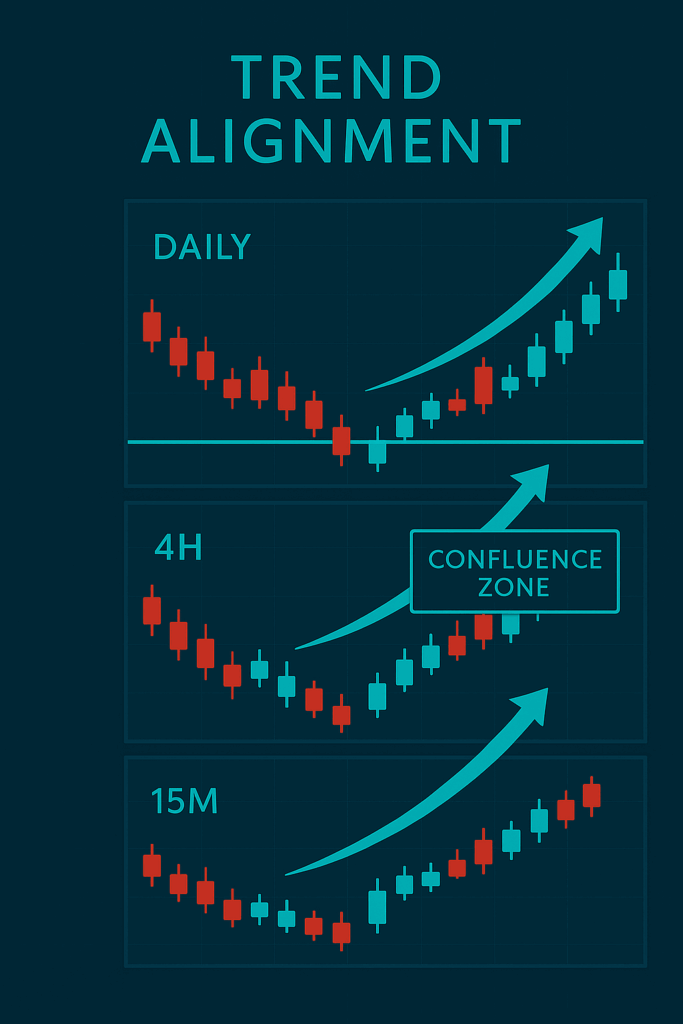
Multi-timeframe confluence is the alignment of technical signals across different chart timeframes. When higher and lower timeframes “agree” on the direction or momentum of a trade, that confluence gives your entry a statistical edge – a concept deeply rooted in consistent trading habits.
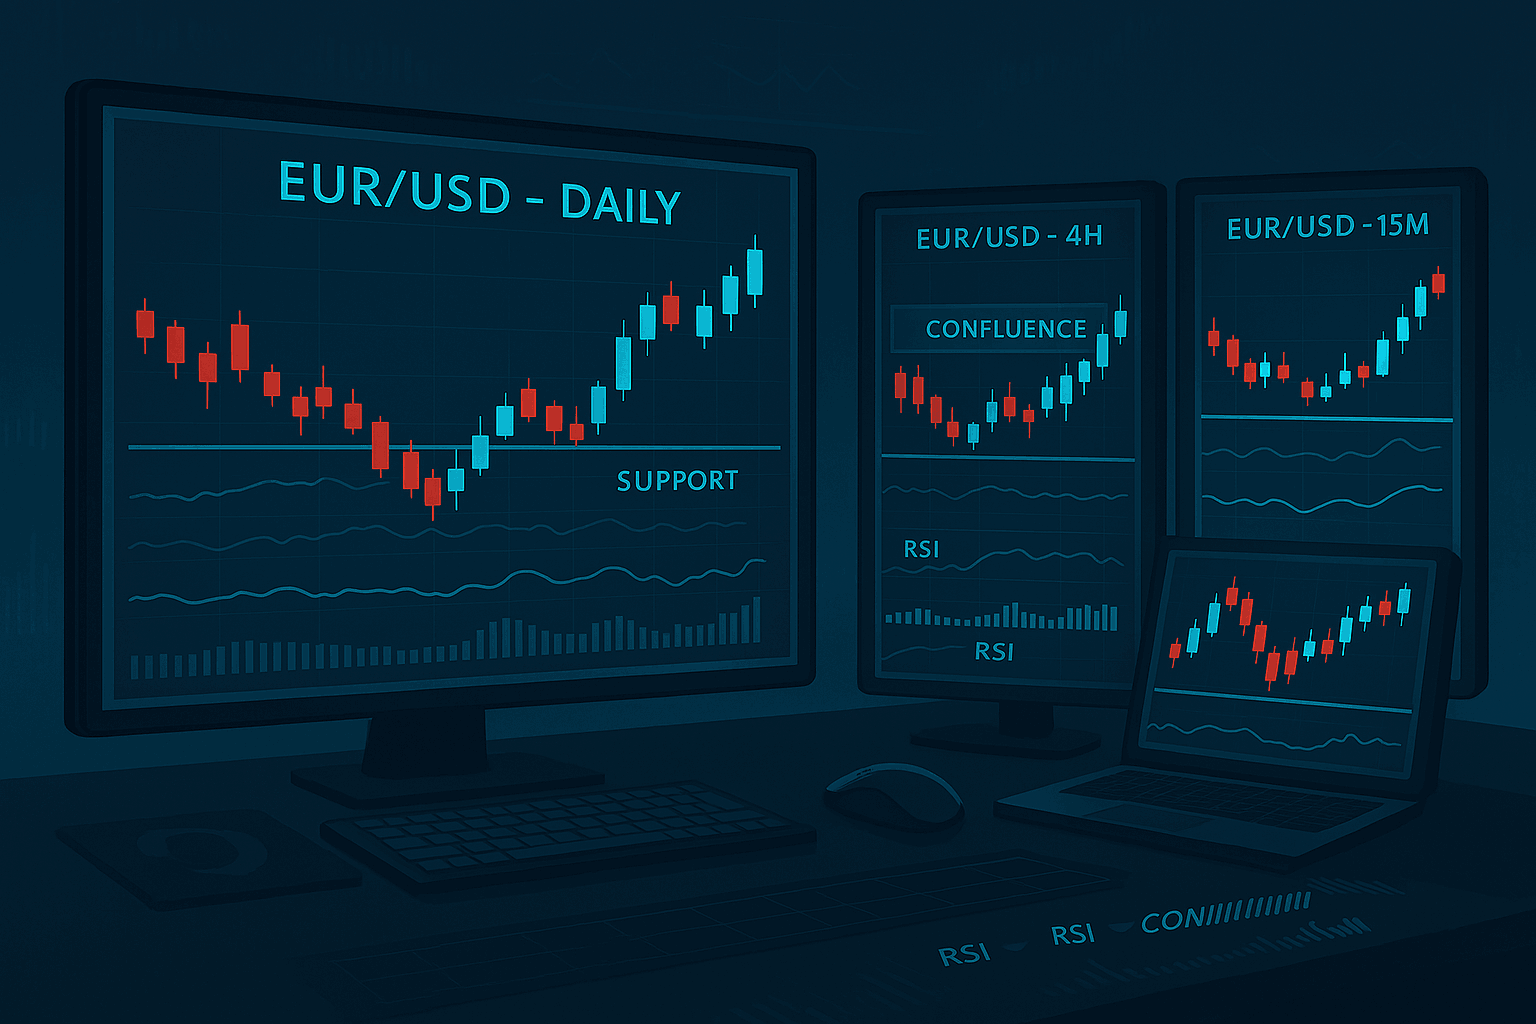
Example:
- Daily Chart shows an uptrend.
- 4H Chart shows a pullback to support.
- 15M Chart shows a bullish candlestick pattern.
✅ That’s a powerful buy setup backed by multiple confirmations.
🔍 Timeframe Hierarchy: Top-Down Approach
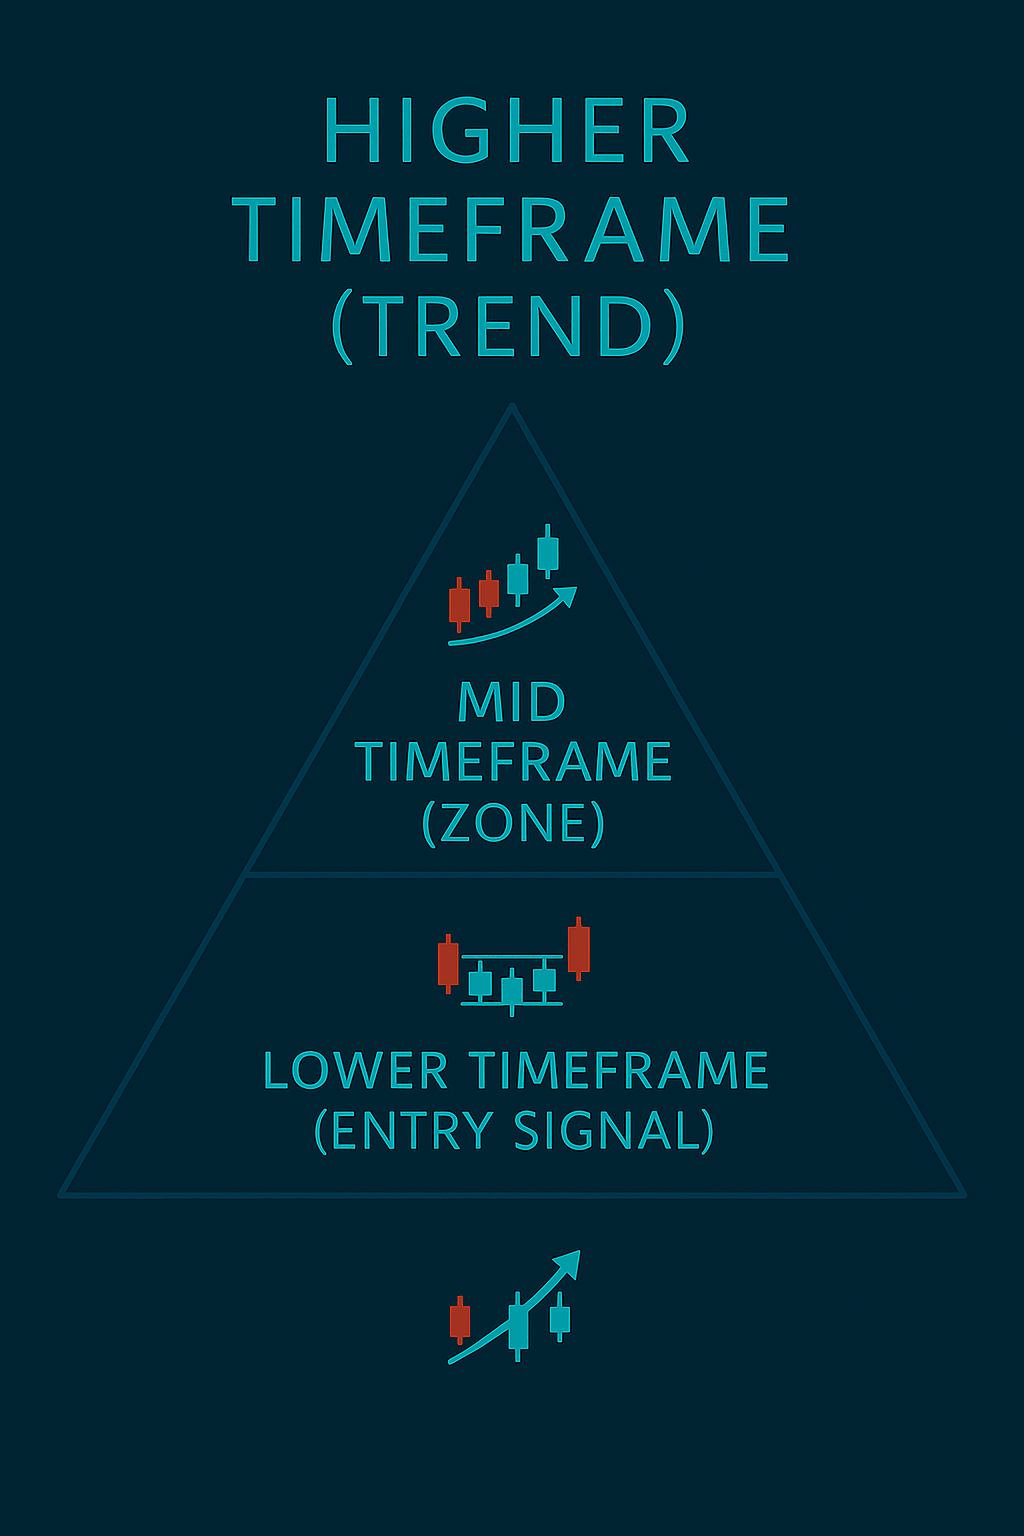
Use this three-step structure for precision entries:
- Higher Timeframe (Trend Bias):
Use the Daily or 4H chart to determine overall market direction. against the larger trend – a mistake highlighted in 5 common forex trading mistakes. - Mid Timeframe (Structure/Zone):
Use 1H or 4H to find key support/resistance or supply/demand zones. - Lower Timeframe (Entry Trigger):
Use 15M or 5M for actual entry signals like candlestick patterns or breakouts.
🛠️ Tools & Indicators for Confluence
- Moving Averages (Multi-timeframe):
Check if price is above the 200 EMA on both the 4H and 15M chart – a classic filter for avoiding false signals. - Trendlines and Channels:
Are they respected across multiple timeframes? - RSI/MACD/Stochastics:
Look for matching signals (e.g., bullish divergence) on both 1H and 15M. - Price Action:
Patterns like pin bars or engulfing candles on the entry timeframe only matter when they align with higher trend context – essential in precision entries.
🎯 Entry Example: Multi-Timeframe Confluence in Action
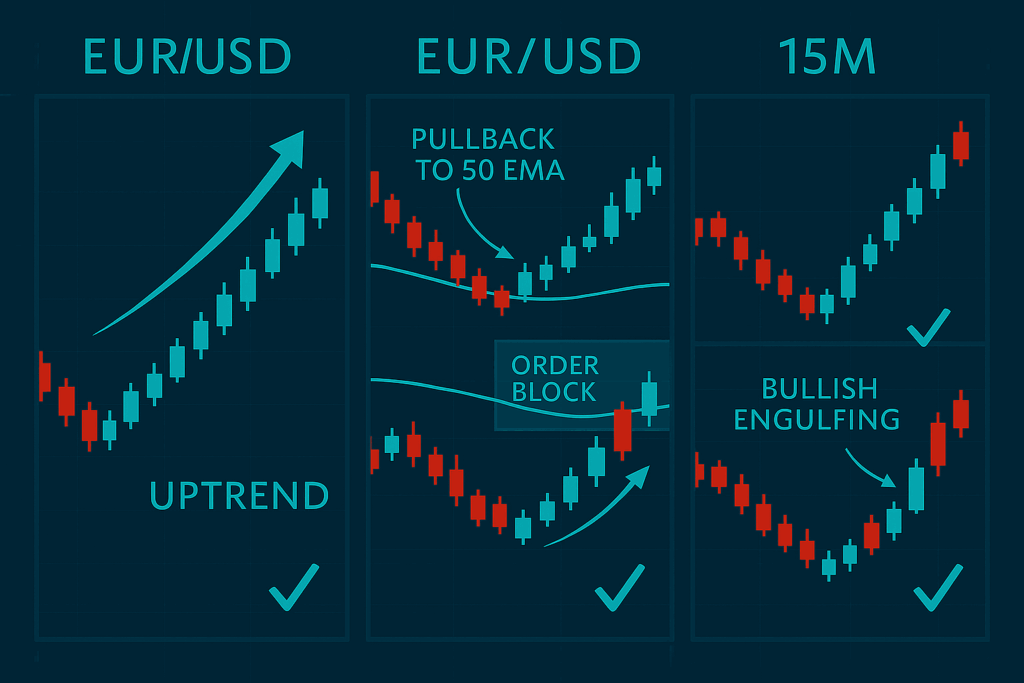
Let’s say you’re trading EUR/USD.
- Daily Chart: Price is trending upward, forming higher highs/lows.
- 4H Chart: Price pulls back to the 50 EMA and bullish order block.
- 15M Chart: Bullish engulfing candle forms at the same level with rising volume.
This setup creates strong confluence:
- Trend ✅
- Zone ✅
- Entry Signal ✅
Now your entry isn’t just based on hope it’s precision-engineered.
⚠️ Common Mistakes to Avoid
- Overloading Timeframes:
Stick to 2-3 relevant ones. Using too many causes analysis paralysis. - Ignoring Context:
A perfect 5M pin bar means nothing if the higher trend is bearish – a pitfall discussed in why many traders aren’t profitable. - Forcing Confluence:
Don’t cherry-pick signals to match your bias. Wait for genuine alignment.
📈 Pro Tip: Use Alerts & Templates
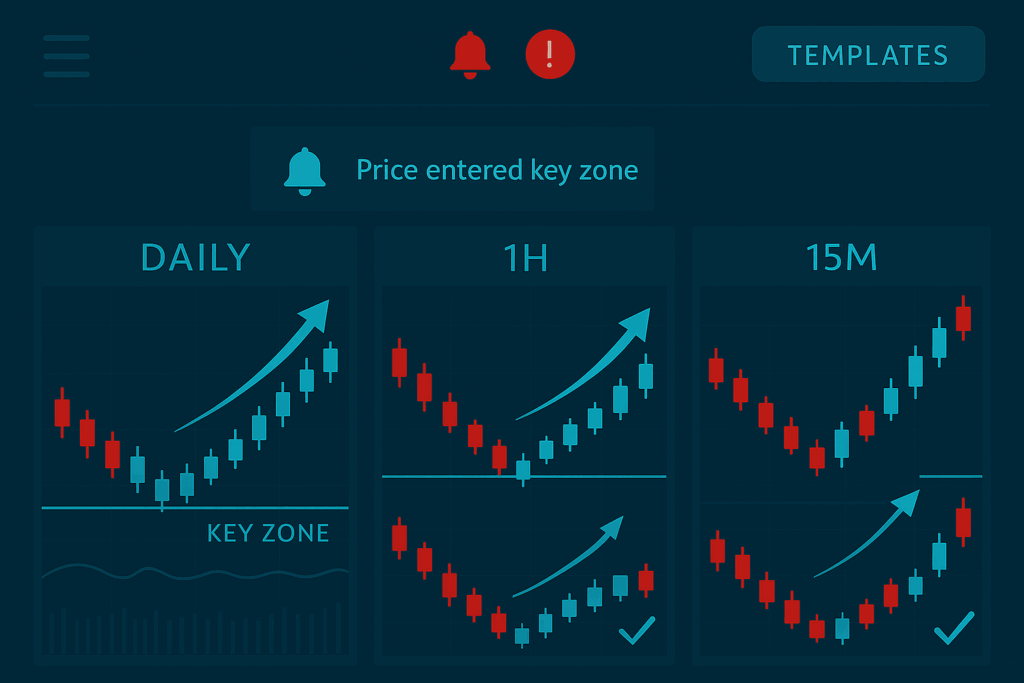
Create chart templates with synchronized indicators across multiple timeframes. Set alerts on higher timeframe zones so you’re ready when price enters your kill zone on the lower timeframes. Tools like alerts and templates help refine your forex trading with discipline and structure.
🧭 Final Thoughts
Multi-timeframe confluence isn’t just a fancy strategy it’s a professional habit. It helps you avoid fakeouts, stay in sync with the broader trend, and enter trades at optimal points. Mastering it takes time, but once dialed in, you’ll wonder how you ever traded without it.
For advanced traders looking to add confluence into your signal-based entries, consider our daily forex trading signals tested, structured, and backed by data.